Inserting a Report Object

How to:

Reference:

This section explains how to insert a Power Painter Report object.


Top of page

x
Procedure: How to Insert a Report Object in Power Painter
  1. Double-click a field in the Data Sources palette and (by default) a report object is automatically inserted in the canvas.
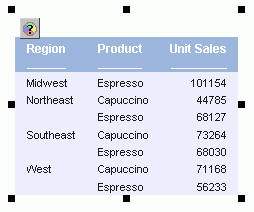
  2. Make sure the desired report object is selected in the canvas.

    The selected object appears with black squares around the perimeter of the object, as shown in the following image.

    Report Object

  3. To automatically add fields to the selected report object, double-click a field in the Data Sources palette.

    Numeric fields, such as decimal and floating point, are automatically added to the Sum folder. Non-numeric fields, such as alphanumeric and date fields, are automatically added to the By folder.

  4. To manually add fields to the selected report object, select a field in the Data Sources palette and drag it to the Query Query button button, which is located above the top left corner of the selected report object.

    The Query pop-up dialog box opens, as shown in the following image.

    Query pop-up

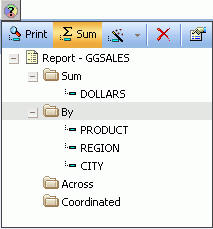
    Continue to drag the field and drop it on the Sum, By, Across, or Coordinated folder.

    Note: By and Across folders are for sorting, Sum folders are for aggregating and displaying, and Coordinated folders contain a common sort field for creating multiple reports and graphs that are burst into separate page layouts. Each value for a coordinated sort field displays on a separate page.

  5. To edit or delete fields in a report, select the desired report object in the canvas, then open the Query pop-up dialog box or Query palette.
    • To open the Query pop-up dialog box, click the Query button above the selected report object (or right-click the report object and select Query from the context menu).
    • To open the Query palette, from the View menu, select Palettes, then select Query from the Palettes submenu.

    The By, Sum, Across, and Coordinated folders appear with the selected fields in the report. You can drag and drop fields into different folders, delete fields, add and edit compute fields, and view report properties for a selected field. You can also select Print to display all of the values found in the data source for a selected field, or select Sum to sum the values of a selected numeric field.

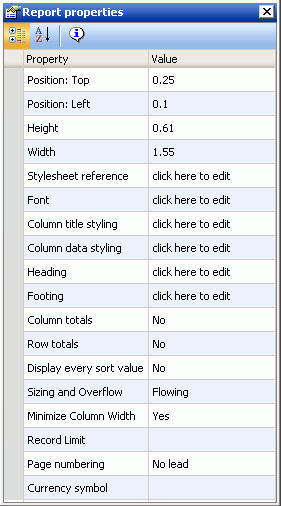
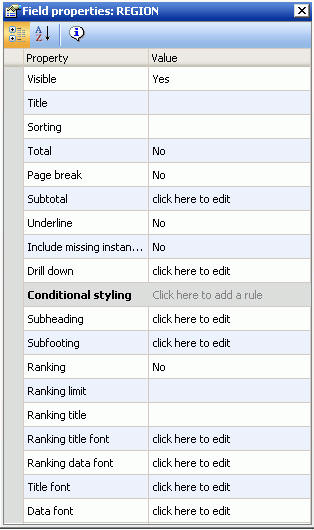
  6. To customize the properties of a field in the report, select the desired field in the Query pop-up dialog box or Query palette, then modify the properties in the Field properties palette, as shown in the following image.

    Field properties

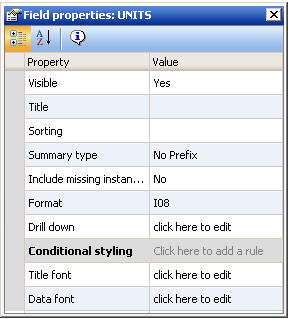
    For details, see Field Properties.

  7. To customize the properties of the entire report, select the desired report object and modify the properties for the report in the Report properties palette. For details, see Report Properties.
  8. Select Save from the File menu to save the report.

Top of page

x
Reference: Report Properties

When a report object is selected, the following properties are available from the Report properties palette.

Report properties

Position: Top

Indicates the starting position for the top edge of the report. You can type in a different value to change the position or manually drag the report on the canvas.

Position: Left

Indicates the starting position for the left edge of the report. You can type in a different value to change the position or manually drag the report on the canvas.

Height

Indicates the height of the report object. You can type in a different value to change the height or manually drag the report object on the canvas.

Width

Indicates the width of the report object. You can type in a different value to change the width or manually drag the report object on the canvas.

Stylesheet: reference

Click the browse (...) button to select an external style sheet. The report references the selected style sheet which controls the global level styling of the report. You can choose from a predefined set of style sheets, or a style sheet from the Import directory.

Font

Shows the default global font for the report.

Column title styling

Click the browse (...) button to open the font dialog box. Select the font, style, size, text, and background color for the column titles in the report.

Column data styling

Click the browse (...) button to open the font dialog box. Select the font, style, size, text, and multiple background colors for the data in the report.

Heading

Adds a heading to the report. Click the browse (...) button to open the Heading dialog box.

  • You can use the Headings toolbar to customize and modify the font, style, size, text color, background color, and others.
  • You can use the Data Sources area to add fields from the Master File as your heading.
Footing

Adds a footing to the report. Click the browse (...) button to open the Footing dialog box.

  • You can use the Footings toolbar to customize and modify the font, style, size, text color, background color, and others.
  • You can use the Data Sources area to add fields from the Master File as your footing.
Column totals

Shows column totals in the report. No is selected by default. To show column totals, use the drop-down list to select Yes.

Row totals

Shows row totals in the report. No is selected by default. To show row totals, use the drop-down list to select Yes.

Display every sort value

Determines when all instances of a vertical sort (By) field are displayed in the report. No is selected by default to omit duplicates. To display every instance of a vertical sort field value, use the drop-down list to select Yes.

Sizing and Overflow

Determines the vertical sizing of the report by setting fixed or flowing overflow. For more information about sizing and overflow, see Setting Overflow Options in Power Painter.

Minimize Column Width

Shrinks the column width to fit the widest value in the report. Yes is selected by default. Select No from the drop-down list to expand all of the columns.

Record Limit

Limits the number of records used to retrieve data at run time.

Page numbering

Select On, Off, or No lead from the list box.

Currency symbol

Overrides the default currency symbol for the reporting server. Use the drop-down list to select from Default, USD, GBP, JPY, EUR, or $. You can also type a one-character custom symbol directly in the value column adjacent to the Currency symbol property.


Top of page

x
Reference: Right-click Report Properties

When you right-click a report object, the following options are available from the dialog box that appears:

Query

Opens the query dialog box.

Size to Fit

Resizes the report as fields are added and deleted.

Delete

Deletes the report.

Properties

Displays the Report properties dialog box.


Top of page

x
Reference: Field Properties

When a report is selected, the following properties are available from the Field properties palette. The field properties available vary depending on the type of sort field selected.

Field properties

Visible

Controls whether a field appears in the report graph, or is hidden. If Visible is set to No, the column is hidden, but is still used in calculations.

Title

Enables you to enter a title for the field in the report graph.

Sorting

Sorts the column data in ascending or descending order.

Total
Applies aggregation and sorting to numeric columns in one pass of the data and is available for Sort by and Sort across fields. You must have an aggregating display field, such as Sum, in the report.
Page break

Starts a new page when the value of a selected sort field changes.

Subtotal

Enables you to display subtotals for numeric data whenever the value of the selected sort (By) field changes. By default, numeric field values are summed and displayed as subtotals. Additionally, you can display other summary values by applying prefix operators to numeric fields, including computed fields, by clicking the browse (...) button to open the Sub Total Options dialog box. For more information, see Displaying Summary Values Using Prefix Operators.

Underline

Includes a horizontal line across the width of a report after the value of the selected sort field changes.

Include missing instances

Displays missing instances of data for related fields in the report.

Drill down

Enables you to supply information to another report by using a hyperlink, procedure, or parameter.

Conditional Styling

Enables you to assign a conditional style to a report element. Conditional styling enables you to define conditions that determine when to apply particular fonts, text style, and others. For more information about conditional styling, see How to Create Conditional Styling Rules.

Subheading

Adds a subheading to the report at sort breaks. Click the browse (...) button to open the subheading dialog box.

  • You can use the subheadings toolbar to customize and modify the font, style, size, text color, background color, and others.
  • You can use the Data Sources area to add fields from the Master File as your subheading.
Subfooting

Adds a subfooting to the report at sort breaks. Click the browse (...) button to open the subfooting dialog box.

  • You can use the Footings toolbar to customize and modify the font, style, size, text color, background color, and others.
  • You can use the Data Sources area to add fields from the Master File as your footing.
Ranking

Includes a column with a numeric rank for each row in a vertically sorted report.

Ranking limit

If specified, this value limits the number of ranked values to be retrieved.

Ranking title

Displays a default column title as RANK with the sort field. You can type in a unique title name for the ranked field.

Ranking title font

Click the browse (...) button to open the font dialog box. Select the font, style, and size for the ranking title.

Ranking data font

Click the browse (...) button to open the font dialog box. Select the font, style, and size for the ranking data.

Title font

Click the browse (...) button to open the font dialog box. Select the font, style, size, text and multiple background colors for the column title.

Data font

Click the browse (...) button to open the font dialog box. Select the font, style, size, text and multiple background colors for the data column.

Table of Contents

Enables you to generate a Table of Contents (TOC) page which shows a summary of the document contents, along with page numbers, and can be printed with the document. The entries in the Table of Contents enable you to easily navigate to a particular section while viewing the document.

Note: The Table of Contents only appears as a field option if you are using a coordinated report.


WebFOCUS