x
Procedure: How to Create Conditional Styling Rules
-
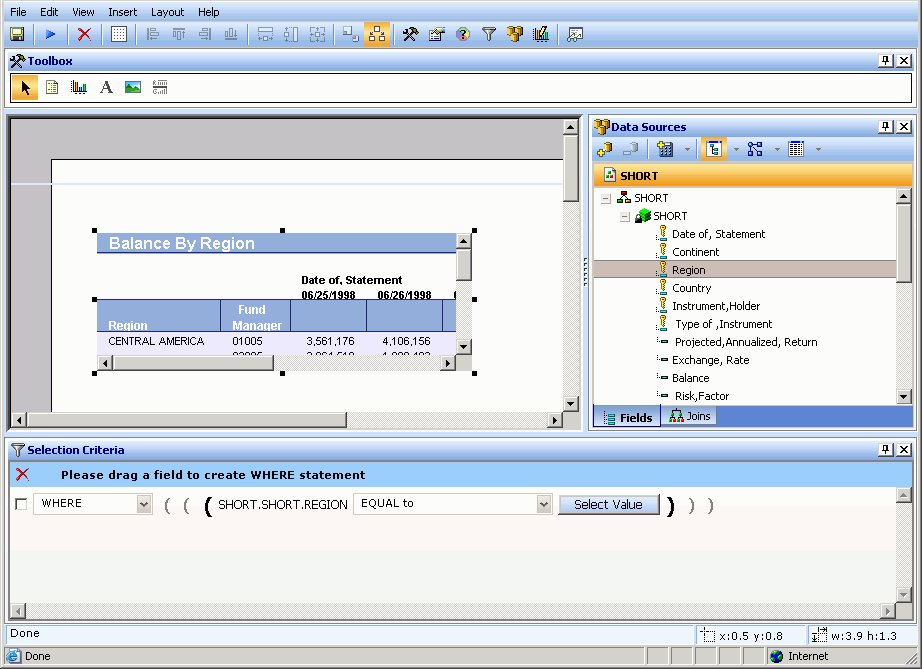
Open the Query pop-up dialog box or Query palette in the canvas.
- To open the Query pop-up dialog box,
click the Query button above the selected
object (or right-click the object and select Query from
the context menu).
- To open the Query palette, from the
View menu, select Palettes, then select Query from the
Palettes submenu.
-
Select the field name in the Query pop-up dialog box or Query palette.
When fields are selected, properties for each field are
available in the Field properties palette.
-
Click the Field properties palette and scroll down until you
see Conditional styling.
-
Click in the Conditional styling value field and select the New
styling rule button.
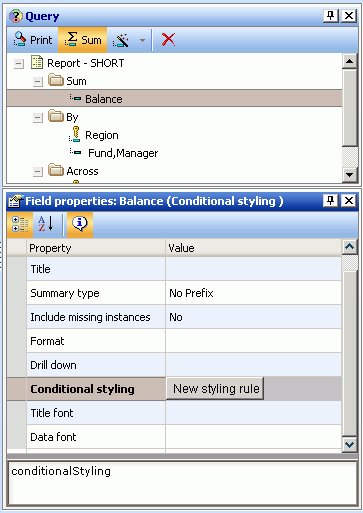
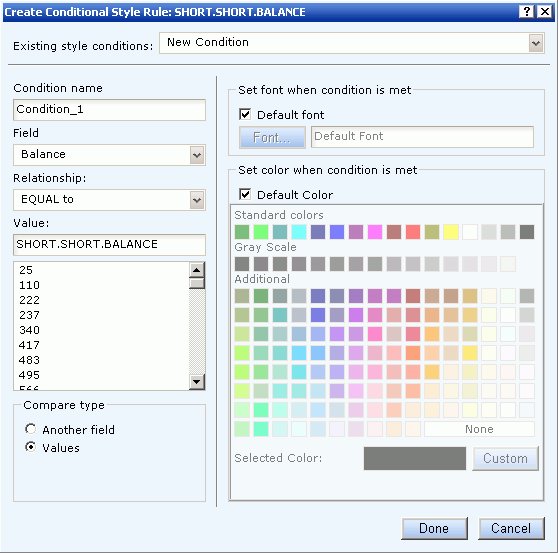
The
Create Conditional Style Rule dialog box opens, as shown in the
following image.
-
Create the style conditions for the
field.
-
Type a name for the condition or accept
the default.
-
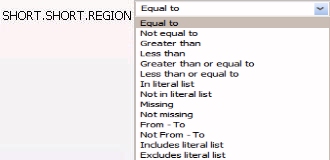
Select a relationship for the condition
from the Relationship drop-down list.
-
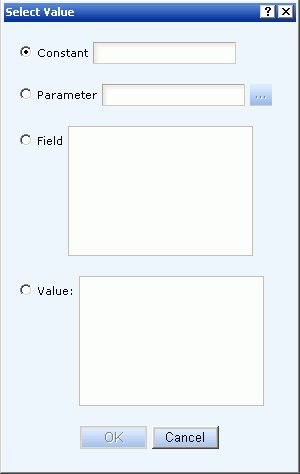
Specify a value by doing one of the following:
- Type a literal
value in the Value input field.
or
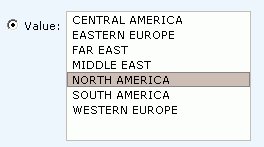
- Click Values from
the Compare type section to display existing data source values.
-
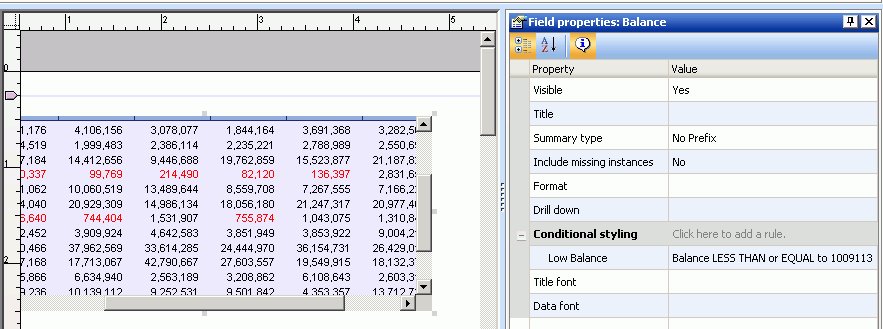
Click Done to save and apply the conditional
style rule.
The condition is added to the Field properties palette
and the condition is applied to the data on the Power Painter canvas.
The
following image is an example of the Field properties palette with
a Low Balance condition rule. The report object shows red text where
the conditional styling rule was applied.
 button
from the Data Sources palette.
button
from the Data Sources palette.
 button
from the Query palette.
button
from the Query palette.