In this section: Reference: |
A domain can contain reports, reporting objects, and Internet hyperlinks. These items are located in the Standard Reports, My Reports, Custom Reports (located within My Reports), Shared Reports, and Reporting Objects folders of a domain.
When you right-click an item from one of these folders, a menu appears that enables you to select one of the options available for that item type. Note that the Schedule, Library Version, and Filter options are available only when applicable. The options for:
Note: When viewing the details of a drill-down report, use the Back button in your browser to return to the original report.
When you delete a report, if the report is the only item in the folder, the folder is also deleted. You also have the option of deleting a folder, including all of its contents. For details about creating My Reports, see Creating Reports in Dashboard.
Reporting Objects are the basis for creating My Reports and contain the data source fields that you can select in a reporting tool to build a report or graph. Reporting Objects are designed by a developer or administrator and are organized within group folders. You can open a Reporting Object with any of the available reporting tools, which include InfoAssist, Power Painter (if applicable), Report Assistant, and Graph Assistant. (If InfoAssist was used to create the Reporting Object, then the only reporting tool available when you right-click that Reporting Object will be InfoAssist.) Using the desired tool, you can select fields for your report or graph, manipulate and style the data, and save the procedure, which is automatically saved in a My Report subfolder named for the group folder where the Reporting Object is located.
For details about using the Library Versions option to view Report Library content, see Viewing Reports in the Report Library. For details about using the Schedule option to schedule reports, see your ReportCaster documentation.
Note:
The following image shows the public view of Dashboard containing the Century Corporation domain. In the Domain Tree panel, right-clicking an item within the Standard Reports folder displays a pop-up menu with options that include Run, Run Deferred, Publish, Schedule (if applicable), Library Version (if applicable), Add to Favorites, Add to Mobile Favorites, and Properties.
The Dashboard Properties dialog box displays General properties for all items plus Detail properties for reports (procedures). General properties include Name, Folder, Folder Href, Domain, Domain Href, Last Modified On, Size, Run, File Name, Created On, Created By, and Last Modified By. The Created By and Last Modified By properties are not displayed by default, but can be displayed when set by the Dashboard administrator.
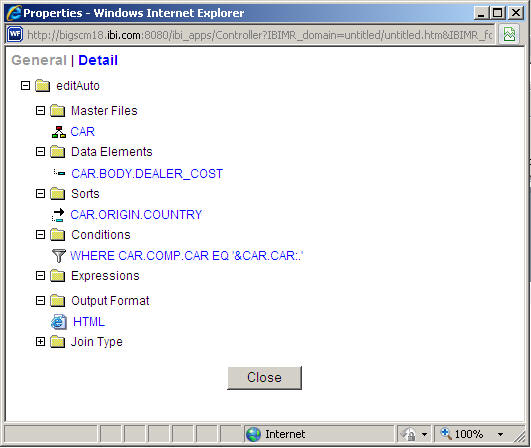
If you click the Detail link at the top of the Dashboard Properties dialog box, details for the procedure associated with the selected report are parsed and displayed in folders that include Master Files, Data Elements, Sorts, Conditions, Expressions, Output Format, and Join Type.
The following image shows General properties displayed in the Dashboard Properties dialog box.
The following image shows Detail properties displayed in the Dashboard Properties dialog box.
When a user opens one of the default folders in the Domain Tree, (Standard Reports, Reporting Objects, My Reports, Shared Reports), a request is sent back to Managed Reporting to retrieve subfolders directly under the top-level folder. As each node of the tree is expanded, only that section of the tree is populated. This reduces the time needed to create the tree when a Domain is selected.
When reports from a folder are loaded into the Domain Tree, only a maximum of 25 report items are loaded each time. A link labeled View More is displayed in the tree to enable users to retrieve up to 25 additional items.
When you create a list, launch, or output block, clicking a folder expands the tree one level at a time.
How to: |
You can apply filters to Standard Reports if filters have been set up for you by the Dashboard administrator. Filters enable you to quickly select predefined criteria to limit the data that is included in the report or graph you are running.
Filter selections stay in effect only for the Dashboard session. Once you log off Dashboard, all Filter selections are cleared.
If the Filter option is not available on the menu, this means filters have not been set up for this report.
The Filter Selection window opens.
Note: The Filter Selection window depends on how your administrator set up the filters. The window shown in the following image includes three check boxes for Year, 1998, 1999, and 2000; three check boxes for Geographic Areas, East, Midwest, and West; and four check boxes for Quarters, first through fourth.
Your selections are saved, and the Filter Selection window closes.
When running a report request, or using InfoAssist, Power Painter (if applicable), Report Assistant, or Graph Assistant in Dashboard, you may be prompted for credentials to connect to the WebFOCUS server, depending on how Dashboard has been configured. If you have questions, contact your administrator.
Once you enter these credentials, the system remembers them for the duration of your browser session, or the duration set by your WebFOCUS administrator. These credentials are not stored on your computer, and are not encrypted in the WebFOCUS cookie. Your browser must be configured to accept cookies in this case.
| WebFOCUS |