Creating Reports in Dashboard
In this section: How to: Reference: |
You can create My Reports using Reporting Objects. You can also
copy a Shared Report and save and modify it as your own My Report.
In addition, you can create new reports from scratch in the Custom
Reports folder. Custom Reports enable you to create your own reports
using a reporting tool or the text editor. Reporting tools include
InfoAssist, Report Assistant, Graph Assistant, and Power Painter.
The tools you have access to are dependent on how your Managed Reporting Administrator
configured the Dashboard environment and whether or not you are
assigned the Advanced privilege. Depending on which tool you use
to create your report, you can edit your report using the same tool
or the text editor. You can change the name of your Custom Report
from the Properties window, and you can create new folders in the
Custom Reports folder.
From Custom Reports, you can also upload (import) an external
data file for use in one of the available reporting tools. For details,
see Uploading Data Files.
You can insert a procedure within another procedure when creating
a custom report. For details, see Execution of a Custom Report Using -INCLUDE.
Note:
- You may not
be able to create reports or Custom Reports in Dashboard if you do
not have privileges to do so.
- If the heading
in a procedure contains a single quotation mark (') and the procedure is
run in a Dashboard that is configured with SiteMinder, a message
appears. This occurs because SiteMinder is configured by default
to block a single quotation mark in a query string.
x
Procedure: How to Create or Delete a My Report in Dashboard
-
In the Domain Tree, expand the Reporting
Objects folder, then expand the desired subfolder.
-
Right-click a Reporting Object and
select InfoAssist, Power Painter, Report
Assistant, or Graph Assistant.
Note: The reporting tools available depend upon
the WebFOCUS Client license key configuration and the Dashboard
configuration set by your Managed Reporting Administrator. If InfoAssist
was used to create the Reporting Object, then the only reporting
tool available from this option list will be InfoAssist.
-
Create the report.
For details on using:
- InfoAssist,
see the InfoAssist User’s Manual.
- Power Painter,
see the Creating Compound Reports With Power Painter manual.
- Report Assistant,
see the Creating Reports With Report Assistant manual.
- Graph Assistant,
see the Creating Charts With Graph Tools manual.
-
Select the
domain in which you want to save the report from the Look
in drop-down menu in the InfoAssist or Power Painter Save
dialog box or from the Save in drop-down
menu in the Report Assistant or Graph Assistant Save dialog box
and click Save.
Note: The Save In and Look In drop-down
menus are lists of the domains to which you are authorized to save
reports. When the Save dialog box opens, the initial Save In or Look
In value is the folder of the domain from which you
ran the report. If the domain from which you ran the report is
restricted not to allow the creation of My Reports, the Save
In or Look In value will default
to the first domain, in alphabetical order, where you are authorized
to create My Reports. If there are no domains listed, contact your
Managed Reporting Administrator to obtain authorization to save
My Reports to a domain.
To delete
a report or folder in My Reports, right-click the report or folder
and select Delete from the menu.
Note:
- Create or edit
only one report at a time when using InfoAssist, Power Painter, Report
Assistant, or Graph Assistant.
- If you log off
Dashboard without first closing the Report or Graph Assistant, you must
manually close the tools.
x
Procedure: How to Copy a Shared Report and Save it as a My Report
Copying
a Shared Report and saving it as a My Report enables you to edit
the report or graph without affecting the original. For details,
see How to Copy a Shared Report.
x
Procedure: How to Create a Custom Report in Dashboard
-
In the Domain Tree, expand the My Reports folder.
-
Right-click the Custom Reports folder
and select one of the following reporting tools:
-
InfoAssist to
create a report or chart using InfoAssist.
-
Power Painter to
create a report, graph, or page layout using Power Painter.
-
Report Assistant to
create a report using Report Assistant.
-
Graph Assistant to
create a graph using Graph Assistant.
-
Editor to create
a report or graph using the Dashboard text editor.
Note: The
reporting tools available depend upon the WebFOCUS Client license
key configuration and the Dashboard configuration set by your Managed Reporting
Administrator.
If you have selected InfoAssist, Power
Painter, Report Assistant, or Graph Assistant, you will be prompted
to select a data source from which you want to report, then click OK to
continue.
The selected tool opens.
-
Design
and then save your Custom Report.
The report is saved in a subfolder
within the My Reports folder.
For details on using:
- InfoAssist,
see the InfoAssist User’s Manual.
- Power Painter,
see the Creating Compound Reports With Power Painter manual.
- Report Assistant,
see the Creating Reports With Report Assistant manual.
- Graph Assistant,
see the Creating Charts With Graph Tools manual.
- Editor, see Dashboard Text Editor.
x
Procedure: How to Copy or Move a Custom Report in Dashboard
-
In the Domain Tree, expand the My Reports folder,
then expand the Custom Reports folder.
-
Right-click the existing report that you want to copy or move.
-
Perform one of the following:
- To copy a
report, select Copy.
Use when you want
to create a copy. Copy and Paste within Custom Reports always creates
a new file with a new internal name because all the My Reports for
a user are stored in a single directory. Managed Reporting uses
the internal name to access the report, as well as in procedures
to reference drill downs, -INCLUDE statements, and style sheet attributes.
For more information on running reports with -INCLUDE, see Execution of a Custom Report Using -INCLUDE.
- To move a
report, select Cut.
Use when you want to
move a report to a different folder within Custom Reports. The internal
file name does not change.
-
Right-click a Custom Reports folder.
-
Select Paste.
When you copy or cut and paste a file within a user My
Reports Custom Reports folder, Dashboard evaluates the request based
on the destination folder and whether or not the internal name and/or
the display name of the source file exists in the destination folder.
This is because all the reports a user creates are stored in a single
directory in the MR Repository. All folders are virtual directories
that allow you to organize your reports. Folder information is stored
in the user metadata (.htm) file located in the user directory within
the MR Repository.
If you paste a file in the same My Reports
Custom Reports folder, Dashboard creates a new file with a new internal
name. Because it is within the same folder, Dashboard assumes you
want to make a copy. A copy number is appended to the name of the
copied file and Dashboard creates a new internal name for this file.
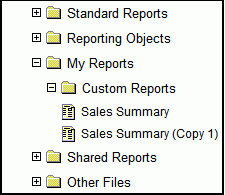
For
example, when you copy and paste a file named Sales Summary within
the same My Reports Custom Reports folder, the copy appears in the
Dashboard tree as Sales Summary (Copy #), as shown in the following
image. The new internal name is sales_summary_copy_1.fex (special
characters and spaces are replaced with underscores).
If
you copy and paste a file to a different My Reports Custom Reports
folder, the Confirm Create New File dialog box opens, as shown in
the following image.
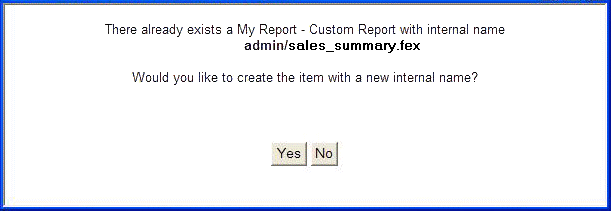
This
dialog box notifies you that the internal name already exists in
the folder and asks you to confirm that you want to make a copy
of the source file with a new internal name.
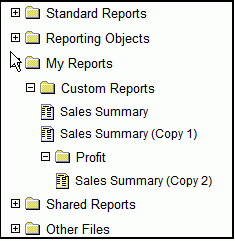
If you confirm
the copy, a copy number is appended to the name of the copied file, as
shown in the following image, and Dashboard creates a new internal
name for this file.
Note: After
pasting a file, you can change the name that displays in the Dashboard
tree of the user interface using the Properties option. This does
not change the internal name (filename.ext) of the file. For more
information on Custom Reports properties, see Editing a Custom Report and its Properties.
x
Procedure: How to Create or Delete New Custom Report Folders
-
In the Domain Tree, expand the My Reports folder.
-
Right-click Custom
Reports and select New Folder.
-
Enter
a name for the new folder in the New Folder dialog box and click Save.
-
The
new folder appears in the Custom Reports folder.
To delete
a folder in Custom Reports, right-click the folder and select Delete.
x
Procedure: How to Edit a Custom Report
Edit only
one report at a time when using InfoAssist, Power Painter, Report
Assistant, or Graph Assistant.
-
In the Domain Tree, expand the My Reports
folder, then expand the Custom Reports folder.
-
Right-click the desired Custom Report
and select the tool you created the report with (InfoAssist, Power Painter, Report
Assistant or Graph Assistant)
or select Editor to edit the report code manually
in the Dashboard text editor.
For details
on using:
- InfoAssist,
see the InfoAssist User’s Manual.
- Power Painter,
see the Creating Compound Reports With Power Painter manual.
- Report Assistant,
see the Creating Reports With Report Assistant manual.
- Graph Assistant,
see the Creating Charts With Graph Tools manual.
- Editor, see Dashboard Text Editor.
Note: After
editing with the Dashboard text editor, you will not be able to use
reporting or graphing tools to open reports created using InfoAssist,
Power Painter, Report Assistant, or Graph Assistant because the
tools cannot read some user-added syntax.
-
Edit
the report as necessary and save any changes.
-
To change
the name of the custom report, click the report and select Properties.
-
Edit
the name in the Description text box.
-
Click OK.
x
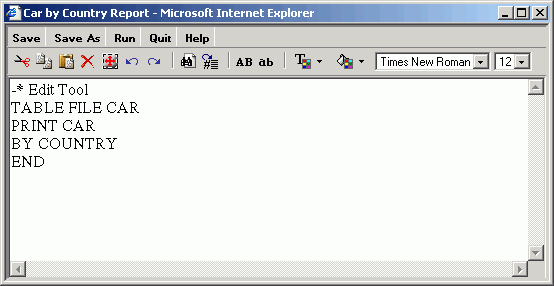
Reference: Dashboard Text Editor
You
can use the text editor to create, view, edit, and run the source
code for Custom Reports in Dashboard. The text editor enables you
to use familiar editing techniques, such as cut, copy, and paste.
You can also find and replace text and specify case.
Note: After
editing with the Dashboard text editor, you will not be able to
use reporting or graphing tools to open reports created with InfoAssist,
Power Painter, Report Assistant, or Graph Assistant because the
tools cannot read some user-added syntax.
The following image
shows the text editor with a sample file in the editing window.
The following table describes all of
the functions available in the Dashboard text editor. The first
column lists the buttons, and the second column lists the actions
they produce.
|
Button
|
Action...
|
|---|
|
 - Save button - Save button
|
Saves the report. Acts as "Save As" the
first time you save the report.
|
|
 - Save As
button - Save As
button
|
Saves the report in the Custom Reports folder
with a name you specify.
|
|
 -
Run button -
Run button
|
Runs the current report.
|
|
 - Quit button - Quit button
|
Exits the Editor window. If you made changes
to the original report, a window prompts you to save or cancel the
changes.
|
|
 - Help button - Help button
|
Opens the online help.
|
|
 - Cut, Copy
and Paste buttons - Cut, Copy
and Paste buttons
|
Cuts, copies, or pastes the highlighted
text.
|
|
 - Delete,
Select All, Undo, and Redo buttons - Delete,
Select All, Undo, and Redo buttons
|
Deletes, selects all, undoes, and redoes.
|
|
 - Find
and Replace button - Find
and Replace button
|
Finds and replaces text.
|
|
 -
Go to line button -
Go to line button
|
Enables you to go to a particular line number
in the report.
|
|
 -
Uppercase button -
Uppercase button
|
Converts highlighted text to uppercase.
|
|
 -
Lowercase button -
Lowercase button
|
Converts highlighted
text to lowercase.
|
|
 - Text
color button - Text
color button
|
Sets the text color in the editor.
|
|
 - Background
color button - Background
color button
|
Sets the background color of the editor.
Note: The
text color and background colors are for the current session only.
|
|
 - Font
drop-down menu - Font
drop-down menu
|
Enables you to change the font of the editor.
|
|
 - Font
size drop-down menu - Font
size drop-down menu
|
Enables you to change the font size of the
text in the editor.
|
Note:
- If you create
a Custom Report using InfoAssist, Power Painter, Report Assistant,
or Graph Assistant, and then edit the report with the text editor,
you can only open and edit the report using the text editor.
- If you use
a Firefox® browser, the editing toolbar, which begins with the cut,
copy, paste features listed in the table, does not appear. Use the
standard control keys (Ctrl+X, Ctrl+C, Ctrl+V) to cut, copy, and
paste.
- When you click
the X in the upper right corner of the text editor, the procedure
is saved, however the Domain Tree does not refresh. To refresh the
Domain Tree contents, click the refresh button (circle with arrow)
in the toolbar.
xWorking With Shared Reports
When you create reports and graphs, you may want to
share them with others in your organization. The Shared Reports
feature addresses this need by enabling you to create reports and
graphs and make them available to other users who access the same
domain.
By designating a report as shared, you allow other users to run
it from the Shared Reports folder in the Domain Tree. Other users
cannot edit a Shared Report in the Shared Reports folder, but they
can copy a Shared Report to their own My Reports folder and then edit
the copied report without affecting the original. All users who
access the Domain Tree have the ability to view, run, and copy Shared
Reports. Note that users with the User role cannot copy Shared Reports.
Only users who have been granted the Shared privilege by their
Administrator can share a My Report. The My Reports that you contribute
appear in the Shared Reports folder of other users and display the
Shared Report  icon.
These reports also appear in your My Reports folder displaying the
same Shared Report icon to denote that they have been made available
to others. Note that Custom Reports can be shared in the same manner
as My Reports.
icon.
These reports also appear in your My Reports folder displaying the
same Shared Report icon to denote that they have been made available
to others. Note that Custom Reports can be shared in the same manner
as My Reports.
The Shared Reports folder in the Domain Tree consists of folders
named for other users who contributed Shared Reports. All the reports
contributed by a particular user appear under the Shared Reports
folder in a subfolder named for the Reporting Objects group folder,
Custom Reports folder, or Custom Reports subfolder where the report
was created. Shared Reports are available to all other Managed Reporting
users who can access the same domain. Note that reports that you
share are not listed in your own Shared Reports folder.
The following image shows three Shared Reports contributed by
a user named Jeff who created and shared the reports from three
different locations: the Custom Reports folder, a Custom Reports
subfolder, and a Reporting Objects group folder named Test IA.
The Shared Reports folder enables you to:
- Run a Shared
Report immediately by clicking the report.
- Run a Shared
Report at a later time by right-clicking the report and selecting Run
Deferred.
- Save the
Shared Report to your My Reports folder by right-clicking the report
and selecting Save As My Report. For details,
see How to Copy a Shared Report.
- View the
information about the Shared Report by right-clicking the report
and selecting Properties. For details, see Dashboard Properties.
- View Report
Library content (if applicable) by right-clicking the report and
selecting Library Versions. For details about
using the Library Versions option to view Report Library content,
see Viewing Reports in the Report Library.
- Schedule the
distribution of the Shared Report (if applicable) by right-clicking
the report and selecting Schedule. For details
about using the Schedule option, see your ReportCaster documentation.
- Add a Shared
Report to your Favorites list by right-clicking the report and selecting Add
to Favorites.
- Add a Shared
Report to your Mobile Favorites list by right-clicking the report
and selecting Add to Mobile Favorites.
- Ensure that
you are viewing the most current list of Shared Reports by clicking
the Refresh Contents icon, located in the
top right corner of the Domain Tree panel.
- Check the
status of a Shared Report that has been run deferred by clicking Utilities in
the Dashboard banner and selecting Deferred Status in
the menu to open the Deferred Report Status Interface window.
x
Procedure: How to Share a My Report
To make an
existing My Report available to other users:
-
In the Domain Tree, expand the My Reports folder, then expand
the Reporting Object or Custom Reports subfolder where the desired
My Report is located.
-
Right-click the report that you want to share and select Properties.
The Properties dialog box opens.
-
Select the Share Report check box and
click OK.
The
Properties dialog box closes and the report becomes available to
all users who access the domain.
x
Procedure: How to Share a New Report
To
make a new report or graph that you are creating available to every
user who accesses the domain:
-
Create and save a report or graph using the InfoAssist, Power Painter,
Report Assistant, or Graph Assistant tool.
You can create and save a report or graph from either the
Custom Reports folder, a Custom Reports subfolder, or a Reporting
Objects group folder.
-
Locate the saved report or graph in the corresponding folder
of the Domain Tree, right-click the report or graph, and select Properties.
The Properties dialog box opens.
-
Select the Share Report check box and
click OK.
Tip: Alternatively,
if you are using Report Assistant or Graph Assistant, when you are
finished creating the desired report or graph, you can click Save
As in the File menu, select the Share Report check
box in the dialog box that appears, type a descriptive name, and click OK.
x
Procedure: How to Copy a Shared Report
To
copy a Shared Report to your My Reports folder:
-
In the Domain Tree, expand the Shared Reports folder.
The Shared Report folder displays folders with the names
of users who have contributed reports.
-
Expand the desired user folder.
The expanded user folder displays subfolders that were
used to create the Shared Reports.
-
Expand the desired subfolder that contains the Shared Report
you want to copy.
-
Right-click the Shared Report and select Save As
My Report.
The Save As My Report dialog box opens.
You can keep
the original name or change the name of the report by deleting the original
and typing a new name in the Description field.
-
Click OK.
WebFOCUS copies the report to your My Reports folder.
After
you copy a Shared Report to your My Reports folder, you can edit
the report without affecting the original.
x
Procedure: How to Edit a Shared Report
-
In the Domain Tree, expand the My Reports folder,
then expand the subfolder that contains the Shared Report you previously
saved as a My Report.
-
Right-click the desired report or graph and select the reporting
tool option (InfoAssist, Power Painter, Report Assistant, Graph
Assistant).
WebFOCUS opens the reporting tool used to create the Shared
Report and displays the report or graph you copied from the Shared
Reports folder.
-
Edit the report or graph and save your changes.
For
details on using:
- InfoAssist,
see the InfoAssist User’s Manual.
- Power Painter,
see the Creating Compound Reports With Power Painter manual.
- Report Assistant,
see the Creating Reports With Report Assistant manual.
- Graph Assistant,
see the Creating Charts With Graph Tools manual.
- Editor, see Dashboard Text Editor.
x
In Dashboard, you can upload
(import) external data files for use in WebFOCUS reporting tools.
This functionality enables you to easily create a WebFOCUS file
description and data file for use in your reporting application. The
Upload Data File option is enabled
by default and is available to all users with access to the Custom
Reports folder of the Domain Tree.
x
Procedure: How to Upload a Data File
-
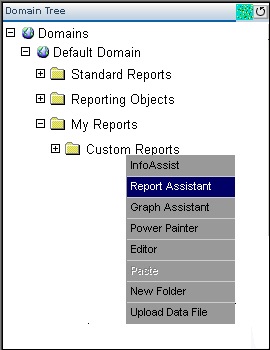
In the Domain Tree,
right-click the Custom Reports folder and select Upload Data File, as shown in the
following image.
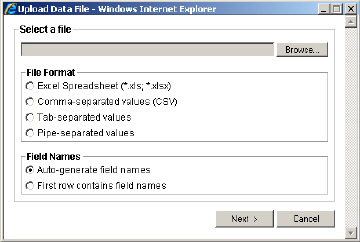
The
first page of the Upload Data File dialog box opens displaying three
sections that require you to make a selection:
- Select a file
- File Format
- Field Names
-
Click the Browse button
to the right of the Select a file section.
A Choose
file dialog box opens.
-
Navigate to the file location and select Open.
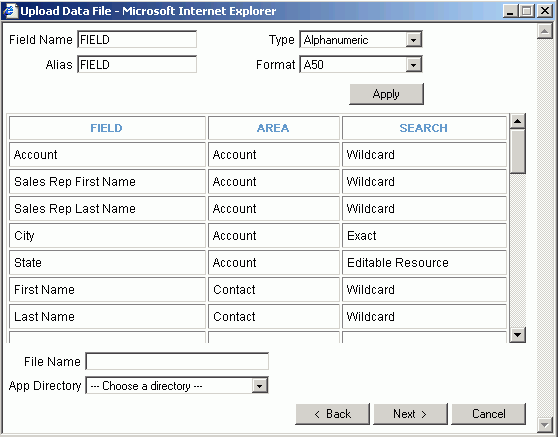
The following image shows the first page of the Upload
Data File dialog box.
-
In the File Format section, select one of the following supported
formats for the file you want to import:
- Excel® Spreadsheet
(.xls, .xlsx)
- Comma-separated
values (CSV)
- Tab-separated
values
- Pipe-separated
values
-
In the Field Names section, select
one of the following options based on how the data file is created:
- Auto-generate field names (the default)
Use
this option if your data file does not contain field names in the
first row. Each data column will be assigned a field name which
can then be customized, as described below.
- First row contains field names
Use
this option if your data file contains field names in the first
row. Please note in this case the first row will not be included
in the uploaded data file. Instead, the Upload File Utility will
extract the first row to assign as field names in the Master File created
during the upload process. Field names can be customized, as described below.
-
Click Next at the bottom of the Upload
Data File dialog box.
The second page of the Upload Data File dialog box, as
shown in the following image, appears for you to review and customize
the file conversion options.
-
For each field in the file you imported, you can select the
field column heading and then edit the following attributes for
that field:
- Field Name
- Alias
- (Data) Type
- Format
The
default format for numeric fields is Double D12.2. For all other
fields, the default format is Alphanumeric A50. During reporting,
to ensure that you see all records and in the correct format, adjust
the field type and format based on your input data file. Base
the maximum value for Format on the maximum length of the fields
in your input file.
If you change any of the attributes
for a field, click the Apply button to apply
the changes and refresh the data.
As of 7703, a new data type
supports Alpha Variable (AnV) data types. The maximum length is
4093 characters and the default display value is 256.
Note: When
you are selecting a format for Alphanumeric data types, it may take
a few seconds for the Format drop-down list to appear.
-
Once you have reviewed all fields, enter a valid name in the
File Name input box (spaces are not allowed) and use the Application
Directory menu to select the location where the file should be created.
You must have write access to this location.
-
Click Next to upload the file.
Three files are created in the selected Reporting Server
Application:
Note: If a file
with the same file name already exists, a dialog box is displayed
prompting you to allow file replacement.
x
Reference: Upload Data File Considerations
- The time required
to complete the upload depends on the machine configuration (for
example, type of processor, amount of memory, and speed). The Upload
utility supports files up to five megabytes. It is recommended that for
up to a five megabyte file, you set the max Java memory heap size
to two gigabytes on the application server.
- If your input file
contains empty lines such as a carriage return or a line feed character
at the end of the file, they will be preserved in the upload file.
- If your input file
contains any other empty lines, they will not get included in the uploaded
file.
- When uploading
data from a supported text file, the file must have the same type of
data in each field and the same number of fields in every row.
- When uploading
data from an Excel spreadsheet:
- The data must
be arranged in an appropriate tabular format and the spreadsheet
must have the same type of data in each column and the same number
of fields in every row.
- The data must
be stored in the first worksheet of the workbook.
- Cells with
formulas and special characters are not supported. For example,
if percentages are used the cells should be formatted using the
percentage data type and should not have the percentage special
character "%" in the cell.
- Excel files
must be saved in a binary format. To ensure this, open an Excel
file, select File, select Save
As, use the Save as type drop-down list to select either Microsoft
Office Excel Workbook (*.xls, *.xlsx) or CSV
(Comma Delimited)(*.csv), then click Save.
xIn this section: Reference: |
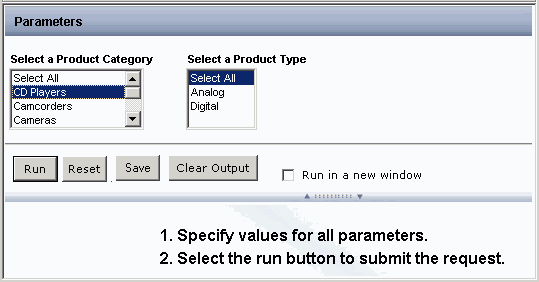
The amper auto-prompting facility enables you to select
parameters and run the report while still being able to view and
change your parameter selections. You can also display and hide
parameters to widen the screen as needed. For example, the following image
shows a report that requires parameter selection.
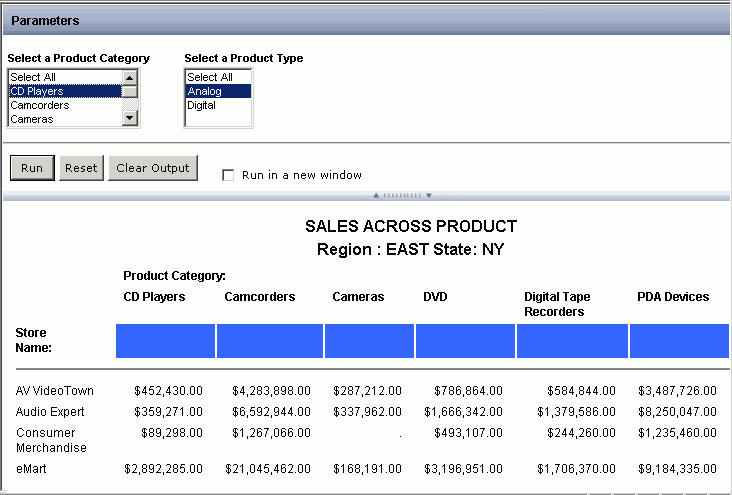
After you run the report, the output appears, as shown in the
following image.
x
Reference: Parameter Report Options
From
the amper auto-prompting launch page, you have the following options:
|
Button
|
Description
|
|---|
|
Run
|
Click this button to run the report.
|
|
Reset
|
Click this button to reset the parameter
selections.
|
|
Save
|
The save option is only available if the
Administrator has assigned you the Save entered values privilege,
and you run a Standard Report with parameters from the domain tree.
|
|
Clear Output
|
Click this button to clear the report output
area.
|
|
Run in a new window
|
Select this check box to open
the report in a new browser window.
|
|

Show/Hide Parameters
|
Double-click splitter bar to hide parameters
for full screen report view. Double-click splitter bar again to
return to the original parameters and report view.
|
x
Customizing the Amper Auto-Prompting Facility
You can customize the look and feel of the amper auto-prompting
facility by editing the launch page template file you are using.
All of the available launch page templates are located in the ibi\WebFOCUS77\ibi_html\javaassist\ibi\html\describe directory.
The default template is autoprompt_top.css.
If you want to customize the banner, create an image, save it
in the describe directory, and change the background-image property,
which is shown in bold type in the following Cascading Style Sheet
(CSS) code:
#idBannerDiv {
height:41px;
background-image:url(style/logo_banner_TOP.gif);
background-position:top left;
background-repeat:no-repeat;
margin:0px;
margin-top:0px;
cursor:pointer; }
The option to select different launch page templates can be set
in the WebFOCUS Administration Console using the Parameter Prompting
selection under Client Settings, where you can set the IBIF_describe_xsl
value to one of the launch page templates.
You can also enter the name of the desired launch page template
in a FOCEXEC using the following code:
<describe_xsl>template</describe_xsl>
where:
- template
Is set to one of the following launch
page template values:
- autoprompt_top displays
the parameters horizontally at the top of the page and is the default
template value.
- autoprompt_top_checked is
the same as autoprompt_top, but the Run in a new window check
box is preselected.
- autoprompt displays
the parameters vertically at the left side of the page.
- autoprompt_checked is
the same as autoprompt, but the Run in a new window check
box is preselected.
- autoprompt_simple is
the basic input form.
xSaving Parameter Selections
You can save parameter selection values as a My Report for reports
that run immediately or run deferred. By default, these reports
are saved in the Saved Parameter Reports folder that is automatically
created under the My Reports folder, but you can save parameter
reports anywhere in the My Reports folder structure. If the domain
of the report whose parameter selection values you are using is
restricted not to allow the creation of My Reports, select another
domain. If there are no domains listed, contact your Managed Reporting
Administrator to obtain authorization to save My Reports to a domain.
You can also replace an existing Managed Reporting HTML form
or procedure (FEX) when saving a Saved Parameter report. The replacement
requires that the selected file must be the same type (HTML or FEX)
as the file being saved. There are two cases for saving a Saved
Parameter report:
- HTML, when saved
using the Save Values option in an HTML form created by HTML Composer
- FEX, when saved from
Amper Autoprompt form.
If the selected file type is not the same as the content being
saved, you will receive the following message
To replace a file, the file types must be the same.
Click OK to close the message and return
to the Saved Parameters dialog box, where you can choose another
file or type a file name.
If the file name you type exists for the same file type (FEX
or HTML), you will receive a message stating that the file name
already exists. Click Replace to overwrite
the existing file, or click Cancel to return
to the Saved Parameters dialog box.
Note: Administrators and Developers can save parameter
selection values as Standard Reports.
When you select Run from the menu options for Saved Parameter
Reports, the saved values are used to run the report and the prompt
form does not display. When you select Edit Parameters, the prompt
form appears so you can make changes to the values before running
the request. You can Run Deferred, which also shows the prompt form
before running the request. Additional menu items for Saved Parameter
Reports that are available from Dashboard are Delete, Add to Favorites,
Add to Mobile Favorites, and Properties. You can also schedule the
report for later execution if you have scheduling capabilities.
Note:
- Saving parameter
selections is only available if you have been assigned the Save
entered values privilege by your administrator.
- Multi-select
drop-down list values are not selected when you view the launch
form for the My Report with saved parameters.
- Prior to Version
7 Release 7.02, the Saved Parameter report and the report from which
it was created must reside in the same Managed Reporting Domain.
If you copy a Saved Parameter report created prior to Version 7
Release 7.02 from one domain to another, you must also copy the
original report to the target domain.
- When creating
multiple saved parameter reports for the same report or graph, if
the report or graph was created in Version 7 Release 6 and earlier,
it is recommended that you create all of the Saved Parameter reports
from the same procedure that contains the report or graph request.
This is recommended because prior to Version 7 Release 6.1, a saved
parameter report has a reference to the procedure (FEX) from which
it was created. If you create a saved parameter report from an existing
saved parameter report, the new saved parameter report has a reference
to the prior saved parameter report, which has a reference to the
original report or graph procedure. This creates a series of chained
dependent procedures, and if one of the chained procedures is deleted,
the reports with references to the deleted procedure will no longer
run successfully.
- If you are
a Developer or Managed Reporting Administrator, you can save Saved Parameter
reports to the Standard Reports or Other Files folders. Note that
the Edit Parameters menu option is not available for auto prompt
reports that are saved with parameter values in the Standard Reports
or Other Files folders. You can edit parameter values from the launch
form or edit the –DEFAULT values for the procedure (FEX) using the
text editor. When you run a Saved Parameter report from these folders,
the auto prompt form launches with the saved parameter values selected.
- Consider the following
when you save a parameter report from an HTML form created with
HTML Composer:
- In Version 7 Release
6.9 and higher, the report is saved as a HTML form and not a procedure
(FEX), and therefore, cannot be scheduled. (For more information,
see Version 7 Release 6.1 and higher Upgrade Considerations.) You can
schedule the report from the HTML form if it includes the Schedule
option. For information on adding ReportCaster scheduling capabilities
to a form, see Designing a User Interface for a Web Application
With the HTML Composer manual.
- In Version 7 Release
7, because Saved Parameter reports created from an HTML Composer
form with Save Value option should not be edited due to their internal
structure, the Restrict Developer Access property is enabled for
these reports. Even though Managed Reporting Administrators can
edit Saved Parameter reports, we recommend that they not because
changes to these reports could render them unusable.
x
Procedure: How to Save Parameter Values to a My Report
-
Run a report that has parameters.
-
Select your parameter values and then
click the Save the Parameter selections as a My Report
 button.
Note: The
appearance of this button may be different depending on your application.
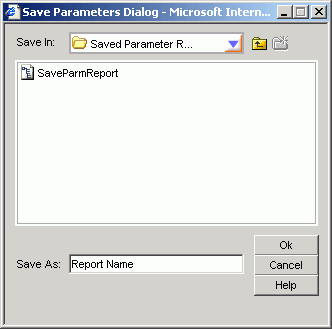
The Save Parameters dialog box opens,
as shown in the following image.
-
From the
Save In drop-down menu, you can navigate to the xxxxxx folder where
you want to save the report.
Note:
- The Save In drop
down menu is a list of domains that you are authorized to save to.
The Save In value that appears when the Save Parameters Dialog box initially
opens is the Saved Parameters folder under the domain where you
ran the report.
- Some domains may
be restricted and not allow you to save My Reports. In this case,
the OK button is not available to you (it is greyed out). When you
select a domain where you are authorized to save My Reports, then
the OK button is available for selection.
-
Type
a name for the report and click OK. The report
is saved in the Saved Parameter Reports folder under My Reports.
Note: You may need to click the refresh button (circle
with arrow) in the toolbar to refresh the domain and view the new
report.