The Author and Strategy subtabs provide authors with
all the capabilities you need to author PMF applications.
The Author subtab allows staff members that have authoring
responsibilities to add, edit, and delete information for scorecards,
measures (loaded, user-entered), objectives, risks, projects, and
processes. It also provides a wizard that streamlines the creation
of scorecards.
The panel buttons in the Author page represent components
that involve scorecards, measures, objectives, projects, and processes.
Click a panel button to view its contents. The following table contains a summary
of the subordinate levels for each component.
|
Component
|
First Level
|
Second Level
|
|
Scorecards
|
Perspective and Themes
|
Objectives
|
|
Measures
|
Measures Source
|
Measure detail...
|
|
Perspectives
|
Measures Source
|
|
|
Objectives
|
Measures Source
|
|
|
Risks
|
Measures Source
|
|
|
Themes
|
Themes
|
|
|
Projects
|
Objectives
|
Measures Source
|
|
Processes
|
Objectives
|
Measures Source
|
If you are in demo mode, meaning you are accessing pmf_manufacturing
or a similar file, the first panel button in the
Author page, Scorecards, includes a sample scorecard that you can use
to learn how to navigate within PMF. For more information, see Navigating
the Scorecard Tree. When the Scorecards panel button is selected,
two buttons are displayed. The New button opens the New Scorecard
panel, where you can create a new scorecard. The Wizard button opens the New
Scorecard Wizard, which guides you through the process of creating a
new scorecard. For more information about the Scorecard Wizard,
see Creating
a New Scorecard.
When the next panel button, Measures, is selected, the New button displays. Clicking this button opens the New Measure panel, where you can create
a new measure. For details about creating and editing
measures, see Adding
and Editing Measures.
The Perspectives, Objectives, Risks, Themes, Projects, and Processes
panel buttons provide you with options for viewing, creating, editing,
and deleting objectives, risks, projects, and processes. To learn
more about working with these Author page options, see the following
topics:
You can also select the Show My Objects button
at the bottom of the Author page navigation panel to filter out any
objects for which you are not the owner. If the Show all Objects
button is displayed, then you are already viewing just the objects
for which you are the owner. If you select Show all Objects,
all objects for all owners are displayed. Note that the ability
to edit objects is controlled by the Functional Role access of the
owner. To set Show My Objects as the default, set the Object Display
Type setting to U in the UI panel on the
Settings menu. For more information, see Viewing and Editing Default Settings.
Navigating the Scorecard Tree
To view the contents of the sample scorecard, expand
the Scorecard and Strategic - CenturyCorp card folders to display the main scorecard
component, Perspectives.
You can continue expanding folders to reveal additional scorecard
elements and see a big picture view of the scorecard structure.
The Perspectives folder can be expanded to reveal subfolders.
If you expand one of the Perspective subfolders (for example, Customer),
the Objectives folder appears. Expanding any of the Objective folders
reveals the Measures, Projects, and Processes folders, which are
at the core of building a scorecard. For more information about
working with perspectives, see Scorecard
Perspectives.
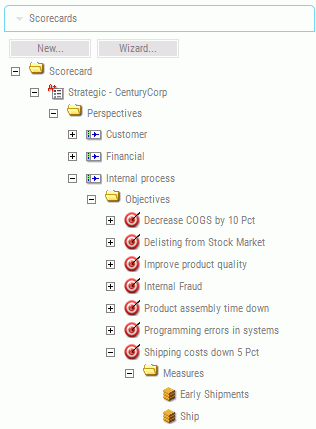
The following image shows the expanded Measures folder for the
objective, Shipping costs down 5 Pct, which are all integral parts
of the Internal process perspective in the Strategic - CenturyCorp card.
The Themes folder, located in the Themes panel, can also be expanded to reveal objectives and
measures elements.
For more information about working with themes, see Scorecard Themes.
Editing, Deleting, and Creating Scorecards
To perform detailed maintenance of a scorecard, expand
the scorecard tree and select a perspective, theme, objective, measure,
project, or process to display the associated Edit panel to the
right of the scorecard tree, where you can make any necessary changes.
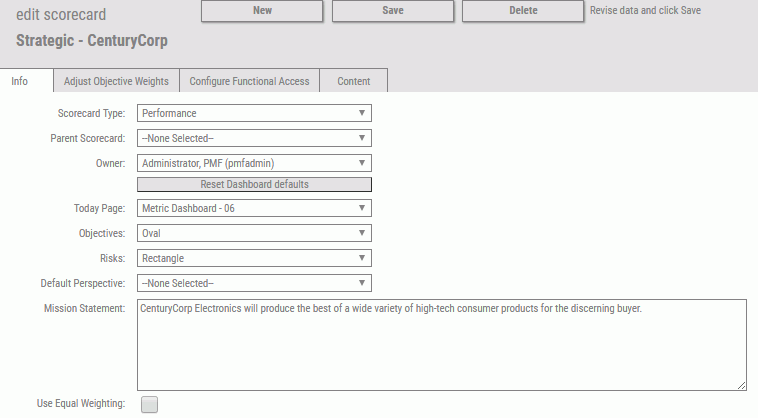
The contents of the existing Strategic - CenturyCorp scorecard are displayed
in the Edit Scorecard panel,
as shown in the following image.
In the Edit Scorecard panel, you can edit the Scorecard Name,
select the Scorecard Type, select a different Parent Scorecard,
change the Owner, and add or edit a scorecard Mission Statement.
You can also select the Object Shape that is used for displaying objectives
in the Strategy Map. For more information about the modifiable fields
of a scorecard, see How to Create a New
Scorecard by Cascading.
There are three additional tabs that enable more functionality
in the Edit Scorecard panel.
- If you click
the Adjust Objective Weights tab, the Objective
Weights panel opens, where you can control the percentage that each objective
represents as part of the overall scorecard strategy. For more information,
see Weighting
Objectives Across a Strategy.
- If you click
the Configure Functional Access tab, the
Edit Scorecard User Access panel opens, where you can configure
Scorecard Functional Access. For more information, see Working With Scorecard Security.
- If you click the Content tab, the Edit Scorecard Content panel opens, where you can control the content that is available in the selected scorecard
by allowing you to link or unlink multiple content items.
When you select the Delete button in the
Edit Scorecard panel, a dialog box appears, asking you to confirm
that you want to delete the scorecard.
Note: If you delete an existing scorecard, you will permanently
remove the scorecard schema, including perspectives, Strategy Map,
objectives, themes, and links to projects, processes, and metrics.


