In this section: |
You can manually add one or more measures to PMF and quickly connect them to objectives in your system. Each of these user-entered measures takes about a minute to add with the New Measure Wizard. For more information, see Working with User-Entered Measures.
If you set up your scorecard using the Scorecard Wizard, and you selected objectives from the list, PMF automatically created measures for you. You can use the Measures panel button to edit these measures or convert them to loadable measures. After you have loaded measures with the loader, use the Edit Measure panel to edit their properties.
Note: This feature is deprecated in PMF 8. Use captured sources instead.
User-entered measures enable users to manually input measures and their targets for any of the following reasons:
- Measure data cannot be loaded (no available data source).
- The measure will always be entered by a user or manager.
- There is no planning system to obtain metric targets.
- Loading metrics would require mass-adjustments to correct inaccurate data.
The benefits to creating user-entered measures include:
- Determines which groups of end users (by Role settings) entered actuals and data for targets.
- Provides an intrinsic data store for metrics components.
- A user-entry screen is accessible directly from a URL.
- Multi-part calculations are supported.
- Archives older measure values.
From the Author or Manage tab, select the Measures panel button. To create a new user-entered measure, select New. To view or edit an existing user-entered measure, select the desired measure in the User Entered Measures folder of the tree structure. After measures are created, they are immediately available on all linked scorecards.
If data for a user-entered measure becomes available at a later date for loading from a data source, you can change the measure to be loaded from external data. You can also change a measure currently loaded from external data to a user-entered measure. To do either, edit the Measure Type field in the Edit Measure Metadata panel.
Users can enter data for a user-entered measure by selecting Measures to Input from the drop-down menu near the upper-right corner of the Today tab. For more information, see Inputting User-Entered Measures.
This will be deprecated in a future release.
-
In the
Author tab, click the Measures panel button,
then click the Wizard button.
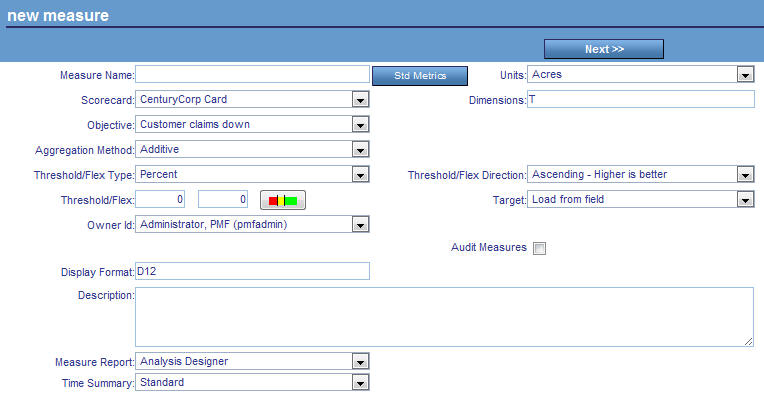
The New Measure Wizard panel opens, as shown in the following image.
-
Specify
values for the fields in the panel.
The following table lists and describes the fields.
Field
Description
Measure Name
Name of the measure. Links to the SERIES field in each atomic measure record. A measure name is linked to a single measure or a pool of production measures. It is used in views that need a common measure name for the often disparately named measures in a particular linked series. The maximum number of characters is 50.
Scorecard
Scorecard to which the measure is linked. This value can be set to a scorecard or left blank if the measure is in the measures pool but not attached to a particular scorecard.
Objective
Objective to which the measure is linked. Choose an objective from the drop-down menu. This field is blank if the measure is unlinked (most typically an unlinked measure is used when creating a relaxed measure). If the scorecard field above is blank, this field should also be left blank.
Aggregation Method
Method you can use when aggregating this measure in views.
Select Additive for measures that represent linear quantities (for example, Dollars, People, Hours, and so on).
Select Percentage if the measure represents a percentage, so that aggregation can correctly account for separating the numerator and denominator. This aggregates them and then divides the sum.
Select Change in Percentage when the stored values for the measure represent a change from one time period to another. For example, if sales were 10,000 in January and 11,000 in February, the change from January to February is 10%. For regular percentage-based measures, the system stores both a numerator and denominator to correctly sum the measures; for the given example, the stored values would be 1,000 and 10,000. However, unlike percentage-based measure series, Change in Percentage ignores the sign of the denominator. If the January value is -10,000 and the February value is -9,000, the stored values are 1,000 and -10,000; however, the change in percentage is still 10%. The actual calculation of subtracting the January data from the February data is done during the load phase.
Select Ratio to display decimals for measures. For example, a ratio measure displays as .89 where a percentage measure displays as 89%.
Note: Both Ratio and Percentage measure types allow you to use separate numerators and denominators for measure actuals and targets, thus ensuring proper aggregation at every dimensional level. These aggregation types are automatically supported in the measure loader and in all PMF views.
Units
Unit of measure used for this measure. Select a value from the drop-down menu. If you do not see the value you need, you can add it using the Units of Measures panel.
Dimensions
The one-character dimension identifier or identifiers to which the measure is linked. For example, the value TOP means that the measure is linked to the Time, Organization, and Product dimensions.
Threshold/Flex Type
Select the type of value used in the Threshold/Flex fields:
- Percent
- Units
Threshold/Flex Direction
Direction to be used to determine how thresholding is performed.
- Ascending - higher is better
- Descending - lower is better
- Range - should fall within range
For more information about these options, see Indicator Concepts.
Target
Select the type of target you desire.
- Load from field
- Use fixed value
- Aggregate fixed value
When you select Use fixed value or Aggregate fixed value, the Set Fixed Target Values button appears, which opens the Fixed Target pop-up dialog box where you can select the desired target types and enter a target value for each.
Threshold/Flex
The first field is the value to be used for the threshold, which determines when an indicator shows red. The second field is the value to be used to determine the inner edge of the yellow zone. Setting a flex of 0 indicates that the measure does not allow any deviation from the target.
Threshold/Flex Slider
Click the red/yellow/green icon to display a grid that enables you to graphically adjust the threshold and flex values.
Owner Id
The owner ID currently assigned to the measure. You can select another owner to reassign the measure to that owner ID.
Audit Measures
(check box)Select this check box to archive any changes made to the measure in the PMF measures history table, used for reporting purposes.
Display Format
A WebFOCUS numeric display format valid for the unit of measure. Valid format types are D (floating-point double-precision), F (floating-point single-precision), I (integer), and P (packed decimal).
The formats are In, Dn.o, Fn.o, and Pn.d, where n represents the maximum number of digits to display, and .o, which is optional, and .d, which is required, represent the decimal point and the number of digits to display after the decimal point. The maximum number you can code before and after the decimal point is 10 for I, 15 for D, 7 for F, and 31 for P.
For more information about numeric display options, see the Describing Data With WebFOCUS Language manual.
Description
Description of the data loaded for this measure. The maximum number of characters is 1024.
Measure Report
Select an operational or PMF measure view from the drop-down menu to enable users to automatically drill down that view from this measure.
Time Summary
Option to vary how measured data is aggregated over time.
Select Standard to aggregate using standard Time rules. All of the measure data shown at higher time levels adds up to the total of all data at the lowest loaded level (for linear aggregation) and includes all percent or ratio data over the entire time period (for percent, ratio, and change in percent aggregation). This option is the default.
Select Average to show an average value, which calculates a mean average of all the data loaded across the lower Time levels for the duration of the higher level period.
Select Most Recent to show the latest values. Only the most recently loaded value of all the data loaded across the lower Time levels for the duration of the higher level period will be shown.
Note: These options will only be available if the Alternate Time Summary setting in the Summarization settings is enabled.
-
After
you verify the values specified for all of the fields on the panel, click Next.
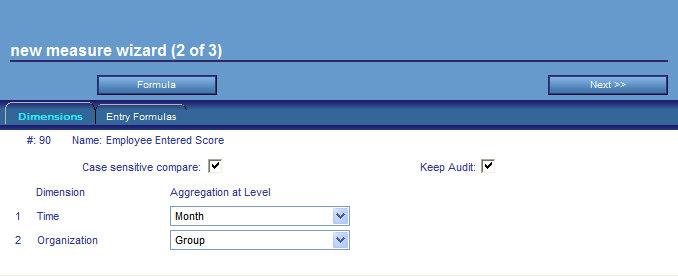
The New Measure Wizard (2 of 3) panel opens displaying the Dimensions tab, as shown in the following image.
-
Specify
values for the fields in the panel.
The following table lists and describes the fields on the Dimensions tab.
Field
Description
Case sensitive compare
(check box)When this option is selected, which is the default, PMF requires the case of the dimension values to match the data source exactly. If there is a mismatch on the dimensionality, it will be flagged as an error. When this option is not selected, PMF uppercases everything before comparing the dimensionality.
Keep Audit
(check box)Select this check box to archive any changes made to the measure in the PMF measures history table, used for reporting purposes.
Aggregation at Level
Select the appropriate level of the dimension at which data will be aggregated.
-
After
you verify the values specified for all of the fields on the Dimensions
tab, click the Entry Formulas tab.
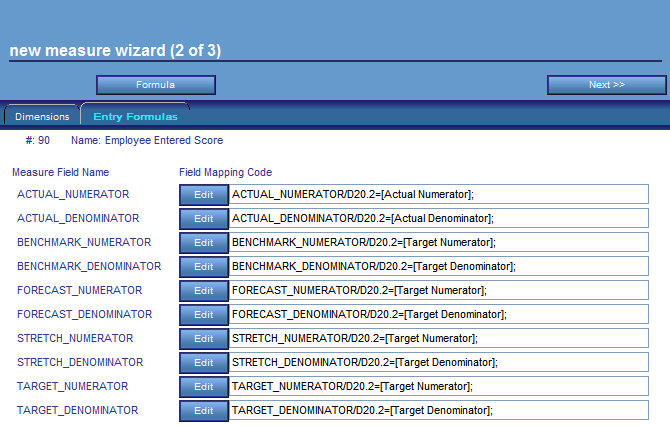
- For each field that displays an Edit button, type a value or a formula to calculate a value in the field to the right of the button. If you have a long formula to enter, click the Edit button, enter the formula in the Field Map input area that opens at the top of the panel, and then click OK.
-
After
you verify the values and formulas specified on the Entry Formulas tab,
click Next.
The New Measure Wizard (3 of 3) panel opens, as shown in the following image.
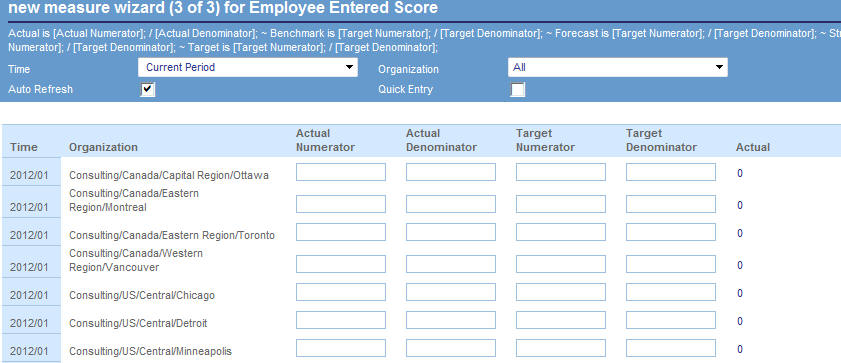
The panel that displays enables you to test entering measure actual, benchmark, forecast, stretch, and target values if desired. You may want to input target values for a measure, since users typically input only actual values, or you might reserve this task for planners or managers at your site.
This will be deprecated in a future release.
If you create formulas for the actual and target values of user-entered measures, users are presented with a multi-cell calculation screen when entering measures. PMF displays the results of the calculation for user verification.
When creating formulas, all fields must be within square brackets. Supported operators are +, -, *, and /, and you can use parentheses to separate operations to create complex formulas. You must use a semi-colon to terminate a formula. The following is an example of a formula:
([Total Calls]-[Dropped Calls])/[Processed Calls]
You can specify which users have access to enter actuals or targets by setting access for their Functional Role from the Manage tab. For more information, see How to Limit Functional Roles to Enter Only Actual or Target Values.
- In the Author tab, click the Measures panel button.
-
Select a user-entered measure.
The Edit Measure Entry panel opens where you can edit any of the settings.
-
Click
the Measure button to edit any of the fields
in the Edit Measure panel.
This panel contains the same fields available when the measure was created in the New Measure Wizard panel, plus additional functionality including buttons to Link/Unlink Objectives and Configure Prediction Processing.
Tip: You can convert user-entered measures to loaded measures by changing the Measure Type from User Entered to Loaded.
- To edit any of the target or actual formulas, select the Entry Formulas tab or click the Formula button.
- To enter any target or actual values, click the Enter Measures button.
Note: In each panel where you make changes, click Save before moving to another panel.
This will be deprecated in a future release.
When you are ready to load production measures from operational data, you can review and edit the properties for specific measures before loading. You may want to adjust the Threshold, Flex, Alert Threshold, and Alert Flex settings to ensure that they reflect the data you are about to load. If you have any user-entered measures that can now be loaded from a data source, you may want to convert these measures to loaded measures.
To review, modify, delete, and add new production measures, there are several different ways you can access measures in PMF. You can:
- Select the Scorecards panel button in the Author tab and fully expand the resulting tree structure all the way down to the measure level.
- Select the Objectives panel button in the Author tab and fully expand the resulting tree structure down to the measure level.
- Select the Measures panel button in the Author tab, select a measure in the User Entered Measures folder, and then click the Measure button in the Measure Entry panel.
- Select the Measures panel button in the Manage tab and expand the tree structure to the measure level.
Selecting any of the individual measures opens the Edit Measure panel where you can view, edit, or delete measures. The following image shows the Edit Measure panel.
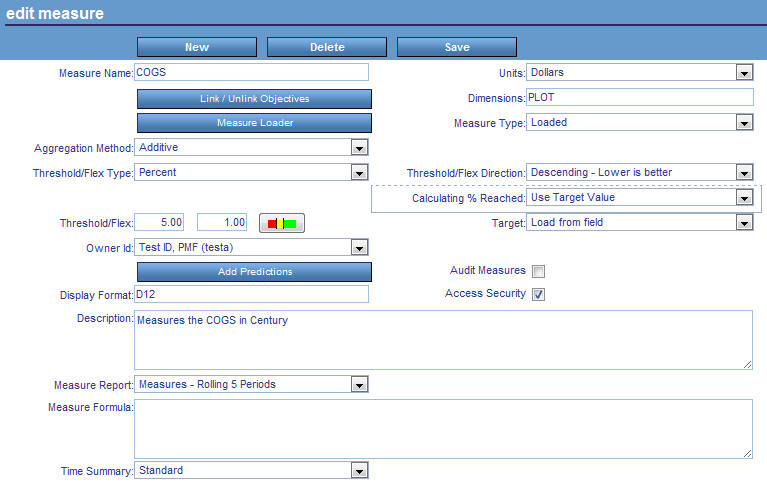
The following table lists and describes the fields in the Edit Measure panel.
|
Field |
Description |
|---|---|
|
Measure Name |
The measure you are editing. |
|
Units |
The unit of measure used for this measure. |
|
Link/Unlink Objectives... (button) |
Displays the Link Measures to Objectives panel, which enables you to link the measure to additional scorecards and objectives. For details on this panel, see How to Link Measures to More Objectives. |
|
Dimensions |
The one-character dimension identifier or identifiers to which the measure is linked. For example, the value TOP means that the measure is linked to the Time, Organization, and Product dimensions. |
|
Measure Loader (button) |
Available only when the selected measure is a production measure. Displays the Measure Loader panel, which enables you to design and complete a measure load. |
|
Measure Type |
Type of production measure.
|
|
Aggregation Method |
Method you can use when aggregating this measure in views. For details, see the Aggregation Method table entry in How to Create a User-Entered Measure With the New Measure Wizard. |
|
Threshold/Flex Type |
The type of value used in the Threshold/Flex fields:
|
|
Threshold/Flex Direction |
Direction to be used to determine how thresholding is performed.
For more information about these options, see Indicator Concepts. |
|
Threshold/Flex |
In the first field, the value used for the threshold, which determines the outer range when an indicator shows red. In the second field, the value used to determine the inner edge of the yellow zone. Setting a flex of 0 indicates that the measure does not allow any deviation from the target. |
|
Threshold/Flex Slider |
Displays a grid that enables you to graphically adjust the threshold and flex values. |
|
Calculating % Reached |
Basis used for calculating the percent (%) reached for the descending measure.
|
|
Basis Value |
Sets a basis value for calculating Pct Reached. This is especially useful if you have a target at, or near to, zero. The Basis determines the amount above your target at which Pct Reached = 0%. This prevents very large negative Pct Reached values from being displayed. This option is only available for Descending Measures. |
|
Target |
Select the type of target you desire.
When you select Use fixed value or Aggregate fixed value, the Set Fixed Target Values button appears, which opens the Fixed Target pop-up dialog box where you can select the desired target types and enter a target value for each. |
|
Owner Id |
The owner ID currently assigned to the measure. You can select another owner to reassign the measure to that owner ID. |
|
Add Predictions... (button) |
Displays the Configure Predictive Data panel, which enables you to select options for predictive data analysis. |
|
Audit Measures (check box)
|
Select this check box to archive any changes made to the measure in the PMF measures history table, used for reporting purposes. |
|
Access Security (check box)
|
When this check box is selected, data is filtered using access security at the security level of the user. |
|
Display Format |
A WebFOCUS numeric display format valid for the unit of measure. Valid format types are D (floating-point double-precision), F (floating-point single-precision), I (integer), and P (packed decimal). The formats are In, Dn.o, Fn.o, and Pn.d, where n represents the maximum number of digits to display, and .o, which is optional, and .d, which is required, represent the decimal point and the number of digits to display after the decimal point. The maximum number you can code before and after the decimal point is 10 for I, 15 for D, 7 for F, and 31 for P. For more information about numeric display options, see the Describing Data With WebFOCUS Language manual. |
|
Description |
Intuitive description of the data loaded into this measure. |
|
Measure Report |
From the drop-down menu, select an operational or PMF measure view to which users can automatically drill down. |
|
Measure Formula |
You can add a text description of the calculation method and source fields that you will use in the load procedure for this measure here. Reports use this field to prompt for actual values displayed for a measure. This field is useful to explain to constituents how a measure was calculated. |
|
Time Summary |
Option to vary how measured data is aggregated over time. Select Standard to aggregate using standard Time rules. All of the measure data shown at higher time levels adds up to the total of all data at the lowest loaded level (for linear aggregation) and includes all percent or ratio data over the entire time period (for percent, ratio, and change in percent aggregation). This option is the default. Select Average to show an average value, which calculates a mean average of all the data loaded across the lower Time levels for the duration of the higher level period. Select Most Recent to show the latest values. Only the most recently loaded value of all the data loaded across the lower Time levels for the duration of the higher level period will be shown. Note: These options will only be available if the Alternate Time Summary setting in the Summarization settings is enabled. |
Loading measures tends to be an administrative function. For more information, see Performance Management Framework Administrator.
- Click the Scorecards panel button.
-
Expand the Scorecard, Perspectives,
and Objectives folders. Select the objective
you want to use.
The Edit Objectives panel opens.
-
Click Link/Unlink Measures.
The Link Measures to Objective panel opens, as shown in the following image.
- In the Link? column in the Measures Available to be Linked section of the panel, select the checkbox across from the desired measure to link the measure to the objective.
- Click the Adjust Measure Weights button to weight the measure across the selected objective. For details on the Weight Measures Across Objective panel, see Weighting Measures Across Objectives.
- To remove a linked measure, click the Unlink? checkbox under the Measures Currently Linked section of the panel.