Predictive Analysis Views
PMF allows you to apply predictive analysis to your
measures. You can design a view that shows historical metrics and
predicts future results, using a wide range of patterns and sampling
frequencies. PMF analyzes data using all available forecasting models,
finds the one that best predicted past performance, and applies
it to predict future performance.
Results are displayed in a side-by-side view that shows the patterns
of change for the metrics. You can use these results as the basis
for planning, or to demonstrate how an existing business strategy
is most likely to succeed or fail.
To fully utilize the predictive analysis functionality of PMF,
you should configure predictive processing for specific measures
to make forecasting results available in related views and reports.
When configuring predictive methods, a map of all available prediction methods
and sampling frequencies is presented for you to determine which
ones provide the best results. You can easily select and change
the method and sampling frequency used for predictive analysis without
having any forecasting or advanced mathematics knowledge. Configuring
predictive processing is performed by authors and administrators
from the Edit Measure Metadata form. For more information, see How to Configure Predictive Data.
The following topics describe and show details of the views that
use predictive analysis and forecasting to extend trends into the
future. These views are available as drill-down options.
Note: To enable users to distinguish between standard
and predictive actual and target data displayed in some views and
reports, cells containing predictive data have a different background
color.
xPerformance Trend (Predictive)
When you click a Measure drill-down hyperlink, for example,
Margins, and select Graph: Performance Trend (Predictive),
the drill down takes you to the Performance Trend view, as shown
in the following image.
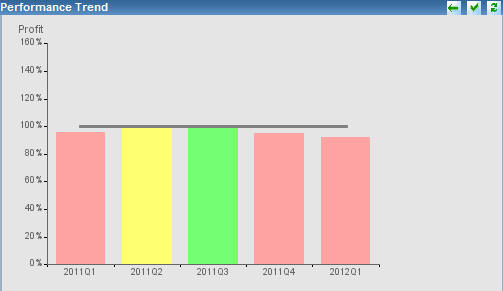
The Performance Trend predictive view shows the performance achievement
for both past and future time periods, displaying graphic performance
indicators side-by-side to visually show patterns of change in the
metrics.
There are no additional drill downs available from this view.
x
When you click a Measure drill-down hyperlink, for example,
Sales, and select Graph: % Reached Histogram (Predictive),
the drill down takes you to the Performance Trend predictive histogram
view. The method (algorithm) used to create the predictive data
in the view varies. PMF analyzes all available methods, identifies
the one that best predicted past achievement, and uses it to predict
future achievement.
The following is an example of a Performance Trend predictive
histogram view, in which the method used is moving average.
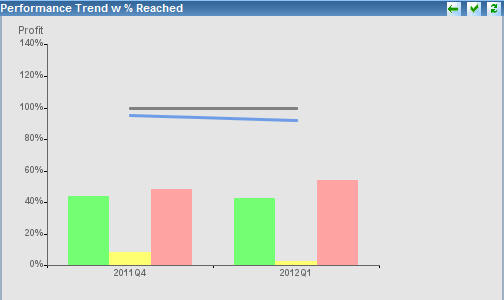
The preceding Performance Trend predictive histogram view shows
the high, mid, and low moving averages for each time period, displayed
in three separate colors, as indicated in the legend.
There are no additional drill downs available from this view.