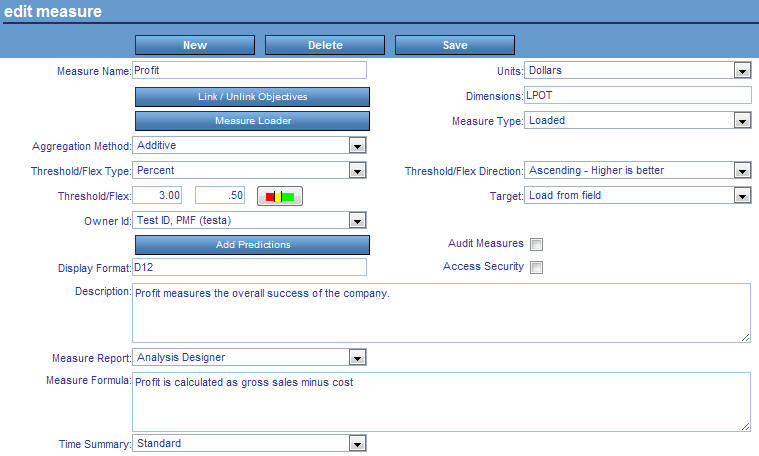
Designing a Simple Measure Load

In this section:

How to:

Reference:

Note: Designing a simple measure load will be depreciated in a future release.

The following is an overview of the steps involved in designing a simple measure load.

  1. Access the Edit Measures form. View the metadata and optionally save the measure you will be loading if it does not exist. For detailed information, see How to Access and Save Measures.
  2. Click Measure Loader.
  3. Select the measure for loading.
  4. In the Dimensions pane, specify information in the required fields. You should:
  5. In the Field Maps pane, specify information in the required fields. Consider whether you are going to use a custom procedure or map on a field by field basis.
  6. In the Filters pane, specify the filters for your measure.

    For detailed information, see How to Design a Simple Measure Load.

  7. Preview the Measure Loader report. For detailed information, see Interpreting the Measure Loader Report.
  8. Save the measure.

Top of page

x
Procedure: How to Access and Save Measures

Note: This will be depreciated in a future release.

The Edit Measure form controls the measure series, each of which is a distinct measure, and its connected rows of values, which you can optionally link to an objective. The Edit Measure form is accessible from the Manage tab. To access data in the Edit Measure form, perform the following steps.

  1. In the Manage tab, click the Measures panel button.
  2. Select a measures source folder.
  3. Select the measure for which you want to view data, for example, Profit. The Edit Measure form, shown in the following image, displays the data for the Profit.

    Edit Measure form

    Note: To create a new measure, right-click a measure and select New.

  4. View the data and change field values as needed. For more information about these fields, see Manage Tab - Measures.
  5. To save an existing prototype measure or a new measure to be loaded, click Save.

Top of page

x
Reference: Manage Tab - Measures

Note: This will be depreciated in a future release.

The following table lists and describes the fields and buttons in the Edit Measure panel.

Field

Description

Measure Name

The measure you are editing.

Units

The unit of measure used for this measure.

Link/Unlink Objectives... (button)

Displays the Link Measures to Objectives form, which enables you to link the measure to additional scorecards and objectives.

For details on this form, see How to Link Measures to More Objectives.

Measure Type

Type of production measure.

  • Loaded
  • User Entered

Aggregation Method

Method you can use when aggregating this measure. Choose from Additive, Percentage, Change in Percentage, or Ratio.

For details, see the Aggregation Method table entry in How to Create a User-Entered Measure With the New Measure Wizard.

Threshold/Flex Type

The type of value used in the Threshold/Flex fields:

  • Percent
  • Units

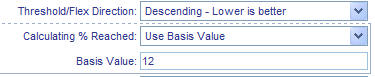
Threshold/Flex Direction

Direction to be used to determine how thresholding is performed.

  • Ascending (higher is better)
  • Descending (lower is better)
  • Range (should fall within range)

For more information about these options, see Indicator Concepts.

Threshold/Flex

In the first field, the value used for the threshold, which determines the outer range when an indicator shows red.

In the second field, the value used to determine the inner edge of the yellow zone. Setting a flex of 0 indicates that the measure does not allow any deviation from the target.

Threshold/Flex Slider

Displays a grid that enables you to graphically adjust the threshold and flex values.

Target

Select the type of target you desire.

  • Load from field
  • Use fixed value
  • Aggregate fixed value

When you select Use fixed value or Aggregate fixed value, the Set Fixed Target Values button appears, which opens the Fixed Target pop-up dialog box where you can select the desired target types and enter a target value for each.

Owner Id

The owner ID currently assigned to the measure. You can select another owner to reassign the measure to that owner ID.

Audit Measures

(check box)

Select this check box to archive any changes made to the measure in the PMF measures history table, used for reporting purposes.

Access Security

(check box)

When this check box is selected, data is filtered using access security at the user's security level.

Display Format

A WebFOCUS numeric display format valid for the unit of measure. Valid format types are D (floating-point double-precision), F (floating-point single-precision), I (integer), and P (packed decimal).

The formats are In, Dn.o, Fn.o, and Pn.d, where n represents the maximum number of digits to display, and .o, which is optional, and .d, which is required, represent the decimal point and the number of digits to display after the decimal point. The maximum number you can code before and after the decimal point is 10 for I, 15 for D, 7 for F, and 31 for P.

For more information about numeric display options, see the Describing Data With WebFOCUS Language manual.

Description

Intuitive description of the data loaded into this measure.

Measure Report

From the drop-down menu, select an operational or PMF measure view to which users can automatically drill down.

Measure Formula

You can add a text description of the calculation method and source fields that you will use in the load procedure for this measure here. Reports use this field to prompt for actual values displayed for a measure. This field is useful to explain to constituents how a measure was calculated.


x
Procedure: How to Adjust the Threshold and Flex Values

Note: This will be depreciated in a future release.

  1. On the Edit Measure panel, click the Threshold/Flex slider Threshold Slider button.

    The next pane shows the current threshold and flex values, and the percentage of the target value reached based on the most current data.

  2. Click and drag the graphic for the value you want to change.

    For the ascending measure shown in the following image, to set the threshold value to 15%, drag the Threshold flag to 85% on the percent ruler, stop when the Threshold flag displays 15%, and click the mouse to anchor the flag. A Flex value is set the same way.

    ascending measure

    The values displayed on the percent ruler are useful when setting threshold and flex values. For ascending measures, the percent values increase from left to right towards the target. For descending measures, the percent values increase from right to left towards the target. For range measures, the percent values increase towards the target and decrease in either direction away from the target.

  3. When you have adjusted the desired values, click Accept to save the specified values and return to the Edit Measures panel.

Top of page

x
Procedure: How to Configure Predictive Data

Note: This will be depreciated in a future release.

  1. On the Edit Measures panel, click the Add Predictions button.

    The Configure Predictive Data form opens, as shown in the following image for the Sales measure series.

    Configure Predictive Data

  2. The Search Width drop-down menu provides choices that give approximate wait times for generating a list of predictive forecasting methods. Select:
    • Narrow (15 seconds) for the fastest search.
    • Medium (1 minute) for a longer and more accurate search.
    • Broad (3 minutes) for the longest and most accurate search.
  3. Click Get Best Methods to calculate and display the best predictive methods available.

    The Configure Predictive Data window opens displaying a time sampling graph and a selectable list of the top 50 predictive methods.

    You can scroll and select any of the other predictive methods listed in the Accuracy Method columns to display the results of that method in the time sampling graph on the form. Compare results until you are satisfied with the selected method.

  4. Click Save & Generate to save the selected method and PMF will use this forecasting method to calculate predictive data for all views and reports associated with the selected measure.

Top of page

x
Procedure: How to Design a Simple Measure Load

Note: This will be depreciated in a future release.

Note: If your procedures and metadata are not located in the Mainstreet application, make sure that you have added the WebFOCUS application containing them to the WebFOCUS Reporting Server APP PATH setting before you attempt a load operation. You can do this using the Web Console.

  1. In the Manage tab, click the Measures panel button.
  2. Select a measures source folder.
  3. Select the measure for which you want to load data, for example, Sales.

    If you do not see the measure you need, you may need to define it in the Edit Measures form. The properties displayed in all of the read-only fields in this form can also be changed in the Edit Measures form. For more detailed information, see How to Access and Save Measures.

    The Edit Measure panel opens.

  4. Click the Measure Loader button.

    The Edit Measure Loader opens to the Dimensions view, showing the fields and options available from the Dimensions tab.

    Edit Measure Loader

    Note: The Edit Measure Loader automatically loads and displays the levels defined for the metadata and checks the measure to make sure it is correctly set up. If anything is wrong, the Load status list displays the error.

  5. Specify the key values of the dimension needed to link your loaded measures to its dimensions. You must make sure the field format matches the key field specified when you loaded the dimension.

    For more information about the available fields and options, see Manage Tab - Measure Loader Fields (Dimensions View), and Manage Tab - Measure Loader Fields (All Views).

  6. Click the Field Maps tab to view your field mappings, which appear similar to the following.

    Field maps tab

  7. Specify the Field Maps required for your measure load.

    Field maps determine how data from the external table is mapped into the PMF field. The target is the goal amount for the metric. Actual is the value to be evaluated against the target. You can specify a single field in the drop-down menu or type a calculation (using standard WebFOCUS formula syntax) that controls how fields from the source are processed.

    For more information, see Manage Tab - Measure Loader Fields (Field Maps View), and Manage Tab - Measure Loader Fields (All Views).

  8. Click the Filters tab to view your filters, which appear similar to the following.

    Edit Measure Loader

  9. Specify the Filters required for your measure load.

    Filters limit the rows of data to be retrieved during the load. Filters are saved and become part of the load logic.

    For more information, see Manage Tab - Measure Loader Fields (Filters View), and Manage Tab - Measure Loader Fields (All Views).


Top of page

x
Reference: Manage Tab - Measure Loader Fields (All Views)

Note: This will be depreciated in a future release.

The following table lists and describes the fields available for all views in the Measure Loader (Dimensions tab, Field Maps tab, and Filters tab).

Fields

Description

Load

Select one of the following options from the drop-down menu:

  • Full Refresh. Deletes all existing records and replaces them with the current load data.
  • Add new, replace actual/target. Adds new load data that does not already exist, replaces existing actuals and targets with new values from the load, retains all existing records not in the load data.
  • Add new, increment actual/target. Adds new load data that does not already exist, increments existing actuals and targets with new values from the load, retains all existing records not in the load data. Useful for transaction-based data loaded on a rolling basis.
  • Add new, replace act/targ, delete old. Adds new load data that does not already exist, replaces existing actuals and targets with new values from the load, deletes all existing records not in the load data.
  • Add new, increment act/targ, delete old. Adds new load data that does not already exist, increments existing actuals and targets with new values from the load, deletes all existing records not in the load data. Useful for a trickle-feed approach to loading data.

On Error

Select one of the following options from the drop-down menu:

  • Nothing loaded if any mismatches. PMF searches for mismatches on dimensions and does not load any data if there are any errors.
  • Bypass errors, load good measures. PMF searches for mismatches on dimensions and does not load any mismatched data.
  • Load everything, including mismatches. PMF searches for mismatches on dimensions and loads all data regardless of whether there are any errors or not.

Source Table

Allows you to select a source table or Master File for the dimension, or you can use this to select sample data you want to view.

Limit display

Type in a number of records. This does not affect loading, only the display of sample data. It improves performance of the Load Wizard. You can leave it at the default (100 records) unless you need to see a deeper data range.


x
Reference: Manage Tab - Measure Loader Fields (Dimensions View)

Note: This will be depreciated in a future release.

The following table lists and describes fields that are specific to the Dimensions view in the Measure Loader.

Field

Description

Case sensitive compare

This option is checked by default. When this option is checked, if there is a mismatch on the dimensionality, it will be flagged as an error in the Measure Loader report. When this option is not checked, PMF uppercases everything before comparing the dimensionality.

Dimension

Lists the type of dimension.

Aggregation at Level

Lets you select the appropriate level of aggregation for the associated dimension.

Join from Key Field

Joins a key field from the measures source table with the associated dimension source table. If there is a field in the measures source table with the same name as the key field in the dimension source table, PMF automatically selects that field as the Join from Key Field. If this is not the correct join field, use this Join from Key Field drop-down menu to select another field.

This option is only available if the Separate table option is selected from the Table Type drop-down menu in the Dimension Loader.


x
Reference: Manage Tab - Measure Loader Fields (Field Maps View)

Note: This will be depreciated in a future release.

The following table lists and describes the fields in the Field Maps view in the Measure Loader.

Field

Description

Define Procedure

Available only if Custom coding is selected as the Source Type.

Select a procedure from the drop-down menu. This is the procedure that contains the defined fields you can use when you load the measure from the source data. The define procedure contains fields mapped to the ACTUAL, TARGET, and THRESHOLD series fields, as well as any component fields used in calculating these values, and any JOINs necessary to perform the calculations.

Date Mapping

If Field Mapping is selected as the Source Type, select one of the following Time dimensions from the drop-down menu:

  • Measure Dt determines Time Dim
  • Source data Contains Time Dim

Measure Field Name

If Field Mapping is selected as the Source Type, the following data metrics are displayed:

  • ACTUAL. This is the value to be evaluated against the target.
  • BENCHMARK. This is the value to be evaluated against the benchmark.
  • FORECAST. This is the value to be evaluated against the forecast.
  • STRETCH. This is the value to be evaluated against the stretch target.
  • TARGET. This is the value of the goal for the related measure.

If Measure Dt determines Time Dim is selected as the Date Mapping option, the following date metric is also displayed:

  • MEASURE_DATE. This is the date when a measure value is effective. The measure date can be used independently from the Time dimension, or it can be used to determine the Time dimension.

If you selected any of the discrete date options beginning with Time Dim, the following date metrics are displayed instead of MEASURE_DATE:

  • YEAR. This is the year attribute of the date when a measure value is effective.
  • MONTH. This is the month attribute of the date when a measure value is effective.

Source

Select one of the following from the drop-down menu:

  • Field. Activates the Field/Field Mapping Code drop-down menu where you will select a field.
  • Code. Displays an Edit button next to the Field/Field Mapping Code field where you will enter, and optionally edit, a filter code statement.

Field/Field Mapping Code

Allows you to do one of the following:

  • If Field is selected in the Source drop-down menu, select a field from this Field/Field Mapping Code drop-down menu.
  • If Code is selected in the Source drop-down menu, enter code here. Field mapping code can span multiple lines, and this field can only display one line of code at a time.

    To view, and optionally edit, multiple lines of code displayed at the top of the Measure Loader, click the Edit button. Click the OK button to save any changes, otherwise click the Cancel button.


x
Reference: Manage Tab - Measure Loader Fields (Filters View)

Note: This will be depreciated in a future release.

The following table lists and describes the fields and option buttons in the Filters view in the Measure Loader.

Field

Description

Add Filter Below

This button adds an additional filter level field below the filter currently selected with the option button to the left of the Filter Name.

Add Filter Above

This button adds an additional filter level field above the filter currently selected with the option button to the left of the Filter Name.

Drop Filter

This button deletes the filter level field currently selected with the option button to the left of the Filter Name.

Move Level Up

This button moves the filter level field currently selected up one level. Use the option button to the left of the Filter Name to select a filter to move.

Move Level Down

This button moves the filter level field currently selected down one level. Use the option button to the left of the Filter Name to select a filter to move.

Filter Name

Name for the filter. You can type a maximum of 50 characters.

Source

Select one of the following from the drop-down menu:

  • Field. Activates the Field/Field Mapping Code drop-down menu where you will select a field.
  • Code. Displays an Edit button next to the Field/Field Mapping Code field where you will enter, and optionally edit, a filter code statement.

Field/Filter Code

Enables you to do one of the following:

  • If you select Field in the Source drop-down menu, select a field from this Field/Filter Code drop-down menu.
  • If you select Code in the Source drop-down menu, enter code here. Field mapping code can span multiple lines, and this field can only display one line of code at a time.

    To view, and optionally edit, multiple lines of code displayed at the top of the Measure Loader, click the Edit button. Click the OK button to save any changes, otherwise click the Cancel button.

Operator

Select one of the following comparisons from the drop-down menu:

  • EQ (equals)
  • NE (does not equal)
  • LE (less than or equal to)
  • LT (less than)
  • GE (greater than or equal to)
  • GT (greater than)
  • LIKE
  • NOT LIKE

Value

Type a value in the field in single quotes (for example, '2001').


x
Reference: Manage Tab - Measure Loader Options (All Views)

Note: This will be depreciated in a future release.

The following table lists and describes the option buttons available for all views in the Measure Loader (Dimensions tab, Field Maps tab, and Filters tab).

Options

Description

Prefix Code

This button opens a field box in which you can type FOCUS or SQL code that will run before the measure is loaded. Click OK to save the code or Cancel to close the field box without saving your changes.

If the table you are using is DBA protected, you can type the command SET USER = user_DBA_ password before you select the source table. For example, the sample Century Corp data uses the password WEBFOCUS.

Formula

This button opens a field box in which you can enter a formula for the measure load. Click OK to save the formula or Cancel to close the field box without saving your changes.

Preview

This button runs and displays the Measure Loader report in the Data for tab of the Measure Loader. This report shows you how the load will be performed. For more information, see Interpreting the Measure Loader Report.

Save

This button saves metadata information for a measure.

Load

This button performs the measure load. Use this after you enter the appropriate information and make the proper selections in all of the required fields of the Dimensions, Field Maps, and Filters tabs. For more information, see Running a Measure Load.

Schedule

This button opens the measure load schedule form, where you can schedule a one-time or recurring measure load. For more information, see Scheduling a Measure Load.

Sample Data

This button displays a report in a new browser window, showing sample data for the source table you selected in the Source Table drop-down menu. For more information, see Sample Data From Source Tables.


x
Specifying Alternate Targets

PMF enables you to specify multiple targets for comparison to your measure actuals. By default, you can use the alternate target types of Forecasts, Stretch Targets, and Benchmarks, which enable you to interface PMF with industry-standard benchmarking systems. This capability is extensible so you can define your own custom alternate target types.

With alternate target types, you can switch the compared target used on any PMF view by changing the Default Target Field on the Systems form on the Settings menu, which you can access by clicking the Settings panel button in the Manage tab. You can also design analysis reports to show multiple indicators comparing multiple instances of alternate targets to your measure actuals.

Alternate targets are attached directly to your measures and can be loaded or entered by users. If you are working with a measure that is loaded from external data, the Measure Loader automatically detects the alternate targets defined in your system. The Field Maps tab in the Measure Loader automatically displays the alternate target fields so you can define how they will be loaded. For more information about the Measure Loader, see How to Design a Simple Measure Load.

To see an example of a report created with alternate targets, see Running the Metrics Vertical Sort View.

For more information about user-entered measures, see Working with User-Entered Measures.

For more information about alternate targets, see Forecasts, Stretch Targets, and Benchmarks in Manage Tab - Measure Loader Fields (Field Maps View).


Top of page

x
Setting a Basis for Descending Measures

How to:

PMF allows you to specify how Percent Reached should be calculated for descending measures with targets set at zero, or where misleading negative Percentages Reached values are shown.

Note: In previous versions of PMF, if there was a descending measure configured and that measure had a target of zero, or if the Actual of the descending measure was very far from the Target in the wrong direction, PMF would automatically calculate Percent Reached as 0% or display a very high negative Percent Reached.

Basis controls where you would have zero Percent Reached. The basis is the point you would exceed with your descending measure greater than which your Percent Reached would start moving into the negative. Any Actuals that were greater would show a negative Percent Reached, while any that were less will show a positive Percent Reached. Setting the Basis gives you control over how Percent Reached is calculated so you can see more reasonable Percent Reached values.


x
Procedure: How to Configure Descending Measure Basis

To configure the Basis for a descending measure:

  1. In the Manage (or Author) tab, click the Measures panel button. Select the measure you wish to change.

    The Edit Measure panel opens.

  2. Select Use Basis Value from the Calculating % Reached drop-down menu. The panel expands and shows the Basis Value field box, as shown in the following image.

    Basis Value Field Box

    Tip: The Basis can be set by analyzing the extend of your Actuals. For example, if your Target is set to zero, the median of your Actual values is 12, and the extent is 30, you could choose 12 as it is the most typical, or median value. You could also do a Pareto analysis and decide that 80% of your measures should have positive Percent Reached values. Suppose a Pareto analysis indicates that 80% of your Actual value spread fell under 18. You could set the Basis to 18 so that any Actual values approaching upward to 18 were scaled down from 100% and any values exceeding it would be negative. If you never want to see a negative Percent Reached, you would set the Basis to the extent of your values. Any Actual values that are precisely at the Basis will show zero Percent Reached.

  3. Click Save to save the changes.

Top of page

x
Running a Measure Load

In this section:

Note: This will be depreciated in a future release.

After you have designed, tuned, and saved your measure load, you can load the data by clicking the Load button in the Measure Loader. A message appears, informing you that the measure you loaded is completed (for example, Successfully loaded (“Sales”)).


x
Scheduling a Measure Load

You can automatically run a saved measure load during specified time intervals using ReportCaster.


x
Procedure: How to Schedule a Measure Load
  1. In the Measure, click the Schedule button.

    The New Schedule form opens.

    New Schedule

    Note: The New Schedule form generates Interval, Start Date, and Start Time values based on the values you specified for the load. You can edit these values as needed.

  2. You can change the Interval, Start Date, and Start Time values. You may be prompted for additional information, depending on the interval you select.
  3. Optionally, enter a new Job description and then click Save to schedule the measure load.

For information on editing a saved schedule, see Manage Tab - Schedules.


WebFOCUS