In this section: How to:
Reference: |
Adding labels to your graph helps provide important information about what the data in your graph represents. You may choose to add headings and/or footings to your graph, as well as style legend text and horizontal (X) and vertical (Y) axis labels.
From the Headings tab of the Graph Assistant, you can add titles, headings, and footings and customize them. For details on customizing, see Customizing Fonts in a Graph.
Note:
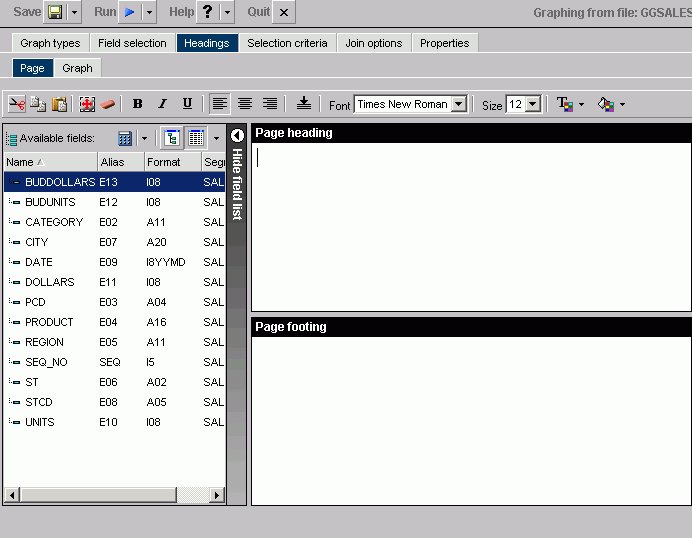
The following image shows the Headings tab, in the Managed Reportingenvironment, with a list of available fields on the left and the Page Heading and Page Footing fields on the right.
The following image shows the Headings tab, in the Developer Studio environment, with a list of available fields on the left and the Page Heading and Page Footing fields on the right.
Note: If your graph labels or legends do not appear correctly when you run your graph, see How to Change Color Settings for details on correcting this.
The following image illustrates where FOCUS Titles and Graph Titles appear in graph output. Note that none of the headings in this sample have been formatted and appear in their default format. Also note that the Graph Titles chart title will appear in the graph output and in the title bar of your browser.
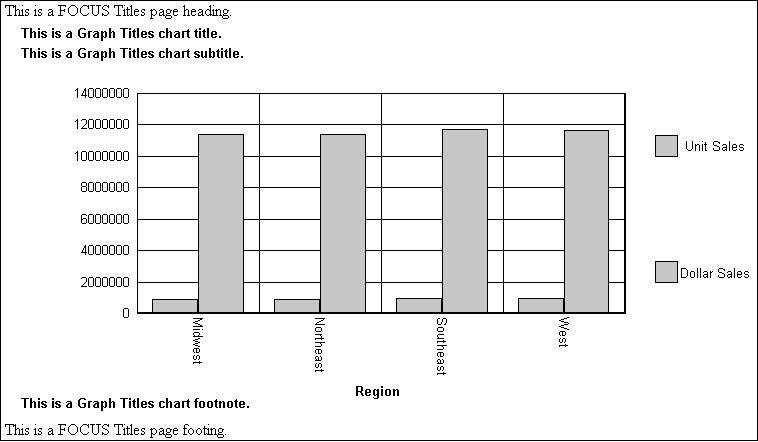
Note: The graph preview reflects all display changes to the graph. FOCUS Titles are not shown in the graph preview.
When you use the Graph Assistant to create a graph and add it to a report in the Document Composer, if the graph contains FOCUS Titles (Page Heading, Page Footing), they are automatically removed from the graph. To utilize headings or footings in a graph you intend to add to the Document Composer, use the Graph Assistant to create Graph Titles (Chart Title, Chart Subtitle, Chart Footnote). You can also add Text objects to a graph in the Document Composer and position them to function as a heading or footing.
or
FOCUS Titles subtab in the Developer Studio environment.
or
Click in the text box to enter a page footing title.
Tip: In the Managed Reporting environment, press Alt+H to enter a page heading or Alt+F to enter a page footing.
Note:
or
FOCUS Titles subtab in the Developer Studio environment.
or
In the Developer Studio environment, click the Add Field Name button.
In the Managed Reporting environment, select a field from the Available Fields window and drag the field to the Page heading or Page footing box.
Tip: The following table lists the shortcut keys you can use, in the Managed Reporting environment,to quickly go to one of the text boxes. The first column specifies the text box you go to when using the shortcut keys and the second column shows the shortcut key combination.
|
Text Box |
Managed Reporting Shortcut Keys |
|---|---|
|
Page Heading |
Alt+H |
|
Page Footing |
Alt+F |
Press Alt+M, Tab to go to the Available Fields window, tab to the field and press Enter to add the chosen field.
or
Graph Titles subtab in the Developer Studio environment.
Note: There is a 95-character limit for Graph Titles.
Vertical (Y-axis) and horizontal (X-axis) graph labels are placed on the graph according to the display fields and sort fields specified in the request. The titles that appear on the graph are the titles that appear in the Master File for that particular field.
The vertical (Y-axis) title of the graph is determined by the display field. Note that when the number of Y-axis labels is greater than one, the labels do not appear along the Y-axis. Instead, the labels appear in a legend that provides the names of the fields being graphed.
The horizontal (X-axis) title of the graph is determined by the sort field.
You can change the titles for the X-axis and Y-axis from the Display sub-tab of the Field Options section on the Field Selection tab in the Graph Assistant.
| WebFOCUS |