How to: |
You can change the font for the X-axis and Y-axis data and labels, legend text, headings, footings, subheadings, and footnotes. From the text properties dialog box you can customize the:
- Font. Select the font type. Note that depending on what fonts you have installed on your machine, some fonts in the text properties dialog box may not be distinguishable from other fonts. In particular, Monospaced and Dialog Input may look the same as well as Dialog and San Serif.
- Style. Select the text style from normal, italic, bold, underline, or a combination of these.
- Size. Select the font size.
- Set Style for. Select either Title or Data to apply style changes.
- Text Color. Select the font color.
- Text Justification. Select left, center, or right justification.
- Autofit. Automatically adjusts the font size to fit the graph and disables the Size drop-down list. To select a different font size, uncheck this box and select the font size in the Size drop-down list.
- Wrap. Check this box to wrap the text.
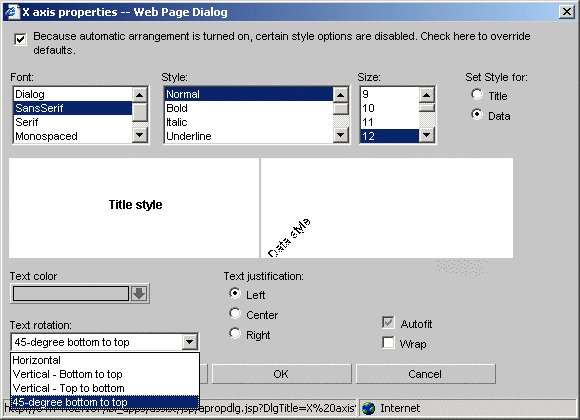
- Text Rotation. Select the data label to display horizontally, vertically (from top to bottom or from bottom to top), and at a 45-degree angle.
- Click the Properties tab and then the X axis tab.
- Click the Style Labels button to open the X-axis properties dialog box.
-
To enable
the text rotation features, select the check box at the top of the
X-axis properties dialog box.
The following image shows the Graph Assistant in the Managed Reporting environment.
The following image shows the Automatic Arrangement check box is selected which enables the list of text rotation features.
Note: If the Automatic Arrangement option is de-selected on the Graph Types tab, the text rotation option is grayed out.
The following image shows the Graph Assistant in the Developer Studio environment. Note that this option is grayed out if the Automatic Positioning option is de-selected on the Graph Types tab.
-
Under
Text rotation, choose one of the following:
- Horizontal
- Vertical - Bottom to top
- Vertical - Top to bottom
- 45-degree bottom
to top
In this case, 45-degree bottom to top is highlighted. Accordingly, the Data Style label is positioned at a 45-degree angle.
As you make changes to the text properties, sample text appears to the right and reflects all selections. If you leave the Autofit check box checked for a particular object, the font size will be automatically adjusted to fit your graph. You can also wrap the text by checking the Wrap check box. Note that when you select the Wrap option, text only wraps to the next line if there is not enough room to display the entire text in the chart.
The text properties dialog box can be opened from many places in the Graph Assistant. Depending on where it is invoked from, different options are available.
Note: You can choose Background and Frame colors in the Options tab in the Properties tab.
- Click the Properties tab of the Graph Assistant.
- Click the X axis subtab.
- Click the Style Labels button. The X Axis Properties dialog box opens.
- Select the font properties. You can change the fonts for the data text and for the X-axis title text by selecting either the Data or Title option button.
- Click OK.
- Click the Properties tab of the Graph Assistant.
- Click the Y-Axis subtab.
- Click the Style Labels button. The Y1 Axis Label Properties dialog box opens. If you are selecting fonts for the Y2 axis, the Y2 Axis Label Properties dialog box opens. It contains the same style options.
- Select the font properties. You can change the fonts for the data text and for the Y-axis title text by selecting either the Data or Title option button.
- Click OK.
- Click the Properties tab of the Graph Assistant.
- Click the Settings subtab.
-
Click
the Style legend text button.
The Legend Properties dialog box opens.
- Select the font properties.
- Click OK.
- Click the Headings tab of the Graph Assistant.
-
Click the Graph subtabin the Managed Reporting environment.
or
Graph Titles subtab in the Developer Studio environment.
-
Click Style
Title, Style Subtitle, or Style
Footnote for Chart title, Chart subtitle, or Chart footnote.
Depending on the option you select, the Heading Properties, Subheading Properties, or Footnote Properties dialog box opens.
- Select the font properties.
- Click OK.