Building a Compound Document
In this section: Reference: |
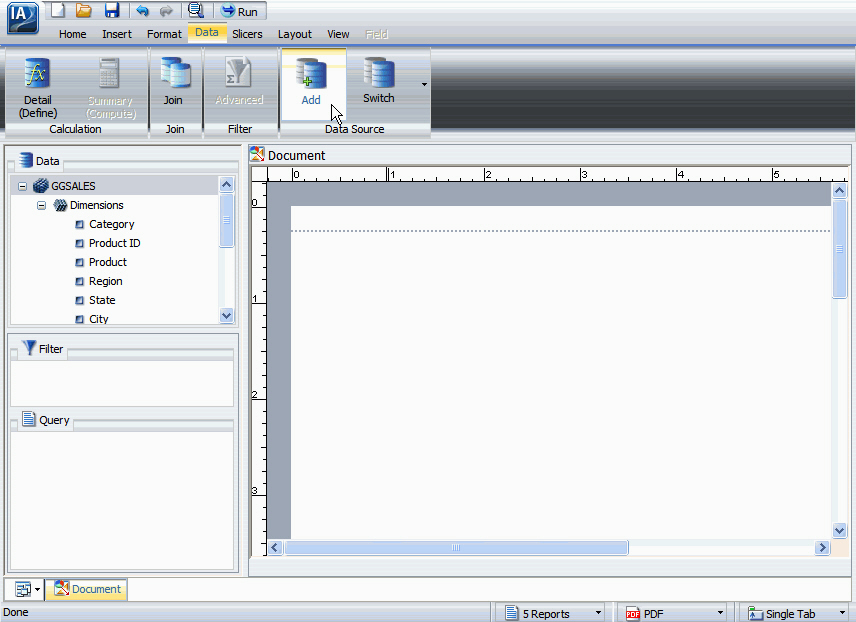
Document
view allows you to build multiple reports and charts on the same
canvas. The styling, design, and report building functionality of
Interactive Design view and Query Design view is available in Document
view, as well as additional features that simplify building compound
documents. You can build and insert multiple reports in the form
of reports and charts. You can also insert images and text for presentation
and organizational purposes.
xCreating a Compound Document From a Single Report
You
can take a single report created in Interactive Design view or Query
Design view and convert it into a Compound document, displaying
it in the Document view.
When you convert a single report
into a compound document, the original report is preserved and a
copy of that report is opened as a compound document in Document
view. You can then add additional reports, charts, images, and text.
x
With
InfoAssist opened in Document view, you can insert multiple charts
and reports onto the canvas. Following the procedures below, you
can insert charts into new compound documents and documents that
are already populated with reports, text, and images.
In Document view, you can insert a chart
in the following ways.
- Use the Insert tab.
- Drag and drop a data
source field onto the canvas.
- Double-click a data
source field.
- Right-click a data
source field.
Note: Using the Insert tab, double-clicking
a data source field, and right-clicking a data source field will
all result in a chart placeholder being inserted in the top-left corner
of the canvas. Dragging and dropping a data source field onto the
canvas will insert the place holder at the location you dropped
the data source field.
The following procedures detail how
to insert new charts. For more information on how to edit existing
charts, see How to Style and Customize a Chart.
x
Procedure: How to Insert a Chart With the Insert Tab
In Document
view, you can insert charts in a number of ways. Inserting charts
with the Insert tab is unique to Document view. For more information
on the Insert tab, see Using the Insert Tab.
-
With InfoAssist
open in the Document view, select the Insert tab
from the Control Panel.
-
Select Chart in
the Reports group, as shown in the following image.
A
chart placeholder appears in the top-left corner of the canvas.
You
can now add fields to the chart using the canvas and the Resources
Panel. For more information on how to use the Resources Panel to
add additional fields to the report, see Understanding the Resources Panel.
x
Procedure: How to Insert a Chart With Drag and Drop
In Document
view, you can insert charts in a number of ways. Inserting charts
by dragging data source fields from the Resources panel onto the
Layout Canvas can be accomplished in both the Interactive Design
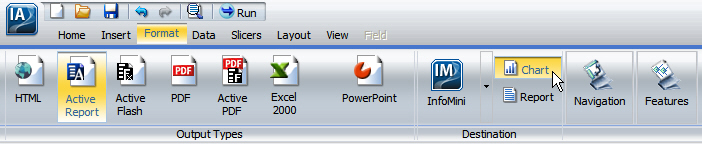
view and Document view. To insert a chart, make sure that Chart
is selected in the Destination group of the Format tab. This option
is also on the Home tab, in the Format group.
-
With InfoAssist
open in Document view, select the Format tab
from the Control Panel.
-
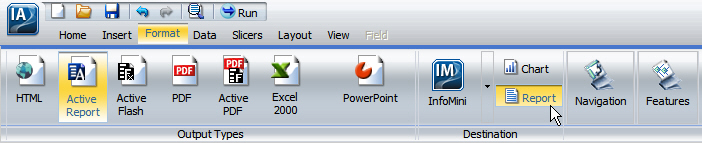
Select Chart in
the Destination group, as shown in the following image.
Note: Chart
can also be selected from the Home tab, in the Format group.
-
Select a
data source field from the Data pane in the Resources Panel and
drag it onto the Layout Canvas. Make sure that you drop the data
source field onto an open area of the canvas and not on top of another
chart or report.
A chart placeholder with the selected data source will
appear in the Results panel, as shown in the following image.
You
can now add fields to the chart using the canvas and the Resources
Panel. For more information on how to use the Resources Panel to
add additional fields to the report, see Understanding the Resources Panel.
x
Procedure: How to Insert a Chart With Double-Click
In Document
view, you can insert charts in a number of ways. Inserting charts
by double-clicking a data source field in the Resources panel can
be accomplished in the Query Design view, Interactive Design view,
and Document view. To insert a chart, make sure that no report is
actively selected on the canvas and Chart is selected in the Destination
group of the Format tab. This option is also on the Home tab, in the
Format group.
-
You cannot
insert a new chart with a double-click if a report is actively selected.
If a report is selected, click the canvas to deselect the report
and make the canvas the active object.
-
Select the Format tab
from the Control Panel.
-
Select Chart in
the Destination group, as shown in the following image.
Note: Chart
can also be selected from the Home tab, in the Format group.
-
Double-click
a data source field in the Data pane of the Resources Panel.
A chart placeholder with the selected data source will
appear in the Results panel, as shown in the following image.
You
can now add fields to the chart using the canvas and the Resources
Panel. For more information on how to use the Resources Panel to
add additional fields to the report, see Understanding the Resources Panel.
x
Procedure: How to Insert a Chart With Right-Click
In Document
view, you can insert charts in a number of ways. Inserting charts
by right-clicking a data source field in the Resources panel can
be accomplished in the Query Design view, Interactive Design view,
and Document view. To insert a chart, make sure that no report is
actively selected on the canvas and Chart is selected in the Destination
group of the Format tab. This option is also on the Home tab, in the
Format group.
-
You cannot
insert a new chart with a right-click if a report is actively selected.
If a report is selected, click the canvas to deselect the report
and make the canvas the active object.
-
Select the Format tab
from the Control Panel.
-
Select Chart in
the Destination group, as shown in the following image.
Note: Chart
can also be selected from the Home tab, in the Format group.
-
Right-click
a data source field in the Data pane of the Resources Panel. A menu
will appear, as shown in the following image.
-
Select from
the available right-click options, which are listed below.
- Include as Measure
- For measure (numeric) fields.
- Include as Category
Axis - For dimension (non-numeric or date) fields.
- Include as Legend
Series - For dimension (non-numeric or date) fields.
- Filter - For all
types of fields
- Coordinated
Note: The
Coordinated field container contains a common sort field for creating
multiple reports and graphs that are burst into separate page layouts.
Each value for a coordinated sort field displays on a separate page.
A
chart placeholder with the selected data source will appear in the
Results panel, as shown in the following image.
Note: The
chart placeholder will turn into a live preview of the chart once both
X-axis and Y-axis data fields are selected.
You can now add
fields to the chart using the canvas and the Resources Panel. For more
information on how to use the Resources Panel to add additional
fields to the report, see Understanding the Resources Panel.
x
With
InfoAssist opened in Document view, you can insert multiple charts
and reports onto the canvas. Following the procedures below, you
can insert reports into new compound documents and documents that
are already populated with reports, text, and images.
In Document view, you can insert a report
in the following ways.
- Use the Insert tab.
- Drag and drop a data
source field onto the canvas.
- Double-click a data
source field.
- Right-click a data
source field.
Note: Using the Insert tab, double-clicking
a data source field, and right-clicking a data source field will
all result in a report placeholder being inserted in the top-left corner
of the canvas. Dragging and dropping a data source field onto the
canvas will insert the place holder at the location you dropped
the data source field.
The following procedures detail how
to insert new reports. For more information on how to edit existing
reports, see How to Style and Customize a Report.
x
Procedure: How to Insert a Report With the Insert Tab
In Document
view, you can insert reports in a number of ways. Inserting reports
with the Insert tab is unique to Document view. For more information
on the Insert tab, see Using the Insert Tab.
-
With InfoAssist
open in the Document view, select the Insert tab
from the Control Panel.
-
Select Report in
the Reports group, as shown in the following image.
A
report placeholder will appear in the top-left corner of the canvas.
You
can now add fields to the report using the canvas and the Resources
Panel. For more information on how to use the Resources Panel to
add additional fields to the report, see Understanding the Resources Panel.
x
Procedure: How to Insert a Report With Drag and Drop
In Document
view, you can insert reports in a number of ways. Inserting reports
by dragging data source fields from the Resources panel onto the
Layout Canvas can be accomplished in both the Interactive Design
view and Document view. To insert a report, make sure that Report
is selected in the Destination group of the Format tab. This option
is also on the Home tab, in the Format group.
-
With InfoAssist
open in Document view, select the Format tab
from the Control Panel.
-
Select Report in
the Destination group, as shown in the following image.
Note: Report
can also be selected from the Home tab, in the Format group.
-
Select a
data source field from the Data pane in the Resources Panel and
drag it onto the Layout Canvas. Make sure that you drop the data
source field onto an open area of the canvas and not on top of another
chart or report.
A report with the selected data source will appear in the
Results panel, as shown in the following image.
You
can now add fields to the report using the canvas and the Resources
Panel. For more information on how to use the Resources Panel to
add additional fields to the report, see Understanding the Resources Panel.
x
Procedure: How to Insert a Report With Double-Click
In Document
view, you can insert reports in a number of ways. Inserting reports
by double-clicking a data source field in the Resources panel can
be accomplished in the Query Design view, Interactive Design view,
and Document view. To insert a report, make sure that no report
is actively selected on the canvas and Report is selected in the
Destination group of the Format tab. This option is also on the
Home tab, in the Format group.
-
You cannot
insert a new report with a double-click if a report is actively
selected. If a report is selected, click the canvas to deselect
the report and make the canvas the active object.
-
Select the Format tab
from the Control Panel.
-
Select Report in
the Destination group, as shown in the following image.
Note: Report
can also be selected from the Home tab, in the Format group.
-
Double-click
a data source field in the Data pane of the Resources Panel.
A report with the selected data source will appear in the
Results panel, as shown in the following image.
You
can now add fields to the report using the canvas and the Resources
Panel. For more information on how to use the Resources Panel to
add additional fields to the report, see Understanding the Resources Panel.
x
Procedure: How to Insert a Report With Right-Click
In Document
view, you can insert reports in a number of ways. Inserting reports
by right-clicking a data source field in the Resources panel can
be accomplished in the Query Design view, Interactive Design view,
and Document view. To insert a report, make sure that no report
is actively selected on the canvas and Report is selected in the
Destination group of the Format tab. This option is also on the
Home tab, in the Format group.
-
You cannot
insert a new report with a right-click if a report is actively selected.
If a report is selected, click the canvas to deselect the report
and make the canvas the active object.
-
Select the Format tab
from the Control Panel.
-
Select Report in
the Destination group, as shown in the following image.
Note: Report
can also be selected from the Home tab, in the Format group.
-
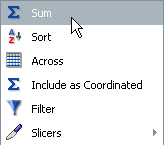
Right-click
a data source field in the Data pane of the Resources Panel.
A menu will appear, as shown in the following image.
-
Select from
the available right-click options, which are listed below.
- Sum
- Sort
- Across
- Include as Coordinated
- Filter
- Slicers
A
report with the selected data source will appear in the Results
panel, as shown in the following image.
You
can now add fields to the report using the canvas and the Resources
Panel. For more information on how to use the Resources Panel to
add additional fields to the report, see Understanding the Resources Panel.
xInserting Reports From Multiple Data Sources
With
InfoAssist opened in Document view, you can insert multiple charts
and reports onto the canvas. These reports can be from different
data sources. With compound documents, you have the option to add
additional data sources to the document.
In order to insert
reports from different data sources, the compound document must have
multiple data sources loaded. For more information on adding and
switching between data sources, see Using the Data Tab.
Note: You do not have the ability
to use multiple data sources when working with a Reporting Object.
x
Procedure: How to Insert Two Reports From Two Different Data Sources
Compound
documents have the ability to display multiple reports from multiple
data sources on the same document.
-
With InfoAssist
open in Document view, insert a chart or report following the instructions
in Building a Compound Document.
-
If your
document has only one data source, insert additional data sources.
For more detailed instructions on inserting multiple data
sources, see Using the Data Tab.
-
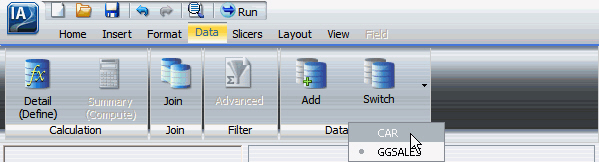
Switch to
a data source different than the one used in step 1.
For more detailed instructions on switching to a different
data source, see Using the Data Tab.
-
Insert
a chart or report using this new data source, following the instructions
given in Building a Compound Document.
Your compound document is now populated with reports that
have data from different data sources. You can add as many data
sources as you need.
xInserting an Existing Report
With
InfoAssist opened in Document view, you can insert existing charts
and reports onto the canvas. Following the procedure below, you
can insert reports into new compound documents and documents that
are already populated with reports, text, and images.
In Document view, you can insert
a report from the Insert tab.
x
Procedure: How to Insert an Existing Report With the Insert Tab
You can create a document in the Custom Reports section of the domain, and use Standard Reports items as Existing Report components. You cannot use other Custom Report items as components.
-
With InfoAssist
open in the Document view, select the Insert tab
from the Control Panel.
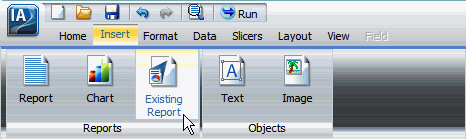
-
Select Existing
Report in the Reports group, as shown in the following
image.
The
Open dialog box will appear.
-
Browse to
the report you want to insert and click OK.
The report will appear in the top-left corner of the canvas.
Resting the mouse on an existing report displays the report title as a ToolTip. You cannot edit an existing report that is inserted into a compound document.
xInserting Text and Images
With
InfoAssist opened in Document view, you can insert text and images
onto the canvas. Following the procedures below, you can insert
text and images into new compound documents and documents that are
already populated with reports, text, and images. Inserting text
and images is a feature unique to Document view and cannot be done
in Interactive Design view or Query Design view.
The following procedures detail how
to insert text and images. For more information on how to edit existing
text and images, see Editing Components in a Compound Document.
x
Procedure: How to Insert Text
-
With InfoAssist
open in the Document view, select the Insert tab
from the Control Panel.
-
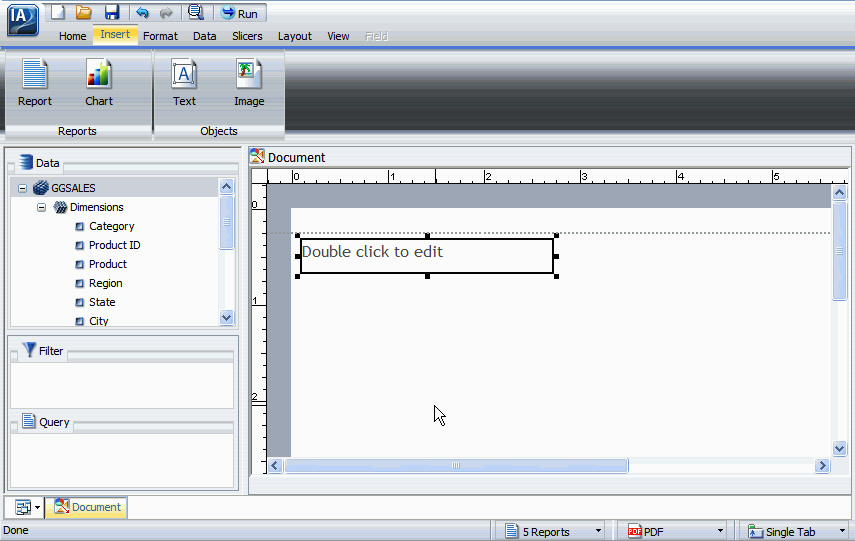
Select Text in
the Objects group, as shown in the following image.
A
text component will appear in the top-left corner of the canvas
with default text, as shown in the following image.
-
Double-click
or right-click the text component to edit the text.
For more information on editing and styling the text,
see How to Edit Text.
x
Procedure: How to Insert an Image
-
With InfoAssist
open in the Document view, select the Insert tab
from the Control Panel.
-
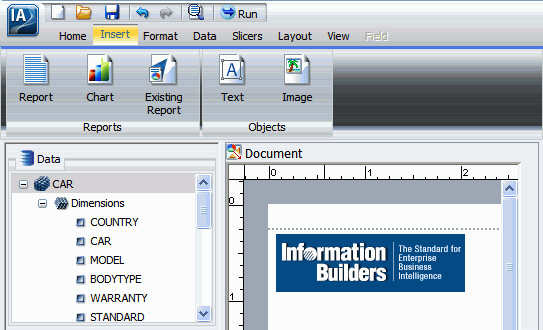
Select Image in
the Objects group, as shown in the following image.
An
Open dialog box appears, as shown in the following image.
-
Browse to
the desired image and press OK.
The selected image will appear in the top-left corner of
the canvas, as shown in the following image.
xEditing Components in a Compound Document
The
reports, controls, and text on a compound document can be edited,
moved, resized, and deleted. Each of these components has a context
menu which can be accessed by right-clicking the component. Images
can be moved, resized, and deleted, but they have no context menu
and cannot be edited. Right-clicking a image will only bring up
the option to delete it.
x
Procedure: How to Resize a Component
You
can resize of a component by clicking it, changing the height and
width from the Size & Arrange group on the Layout tab, or by
accessing the Size section of the Size and Position dialog box.
This feature is available for all components that can be added to
a compound document.
-
Open or
create a compound document with at least one report, text component,
control, or image.
-
Click the
component and resize it using one of the following methods:
-
With a component
selected, sizing handles appear around the component, as shown in
the following image.
Resize
the component by dragging the sizing handles.
or
-
Right-click the
component and select Size and Position.
Select Size from the
left pane, as shown in the following image.
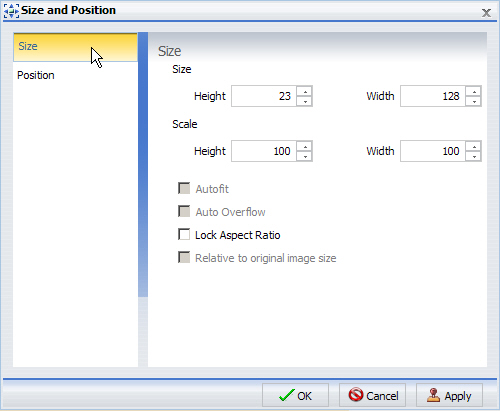
Use
the Height and Width options to change the position of the selected component.
You can adjust the the pixel size of the object with the Size options
or the scale percentage of the object with the Scale options.
or
-
With the component
selected, change the size and width options from the Size &
Arrange group on the Layout tab, as shown in the following image.
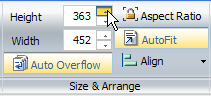
You
can lock the aspect ratio using the Aspect Ratio button. With the
aspect ratio locked changing the width will automatically change
the height to keep the component to scale and changing the height
will automatically change the width.
Note: The
Auto Overflow option is available for reports through the Size &
Arrange group and the Size and Position dialog box. With Auto Overflow
set you cannot manually set the height and width of a report, the
area of the report will expand automatically to show all data.
The
AutoFit option is available for reports through the Size & Arrange
group and the Size and Position dialog box. With AutoFit set reports
will automatically grow to accomodate newly added fields.
x
Procedure: How to Move a Component
You
can move a component by clicking it or by accessing the Position
section of the Size and Position dialog box. This feature is available
for all components that can be added to a compound document. You
can also align components with each other so that their horizontal
or vertical position matches. For more information, see How to Align Components.
-
Open or
create a compound document with at least one report, text component,
control, or image.
-
Click the
component and move it by using one of the following methods:
-
Use the mouse
to drag the component anywhere on the canvas.
or
-
Right-click the
component and select Size and Position.
Select Positon from
the left pane, as shown in the following image.
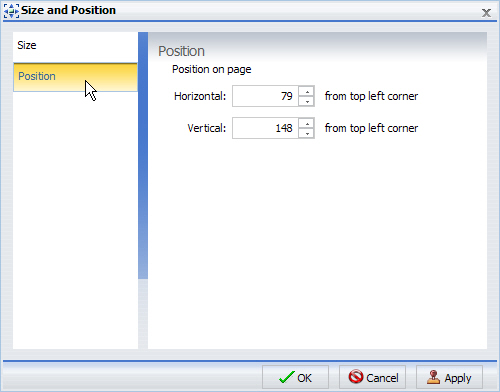
Use
the Horizontal and Vertical options to change the position of the
selected component.
x
Procedure: How to Align Components
You
can align components with each other so that their horizontal or
vertical position matches. You must have multiple components selected
to use the align options.
The alignment is anchored by the
component that is farthest in the selected alignment position. For
example, if you select two components and then select Align Left,
the components will be aligned horizontally with the far left component.
-
Open or
create a compound document with at least two components.
-
Select a
component.
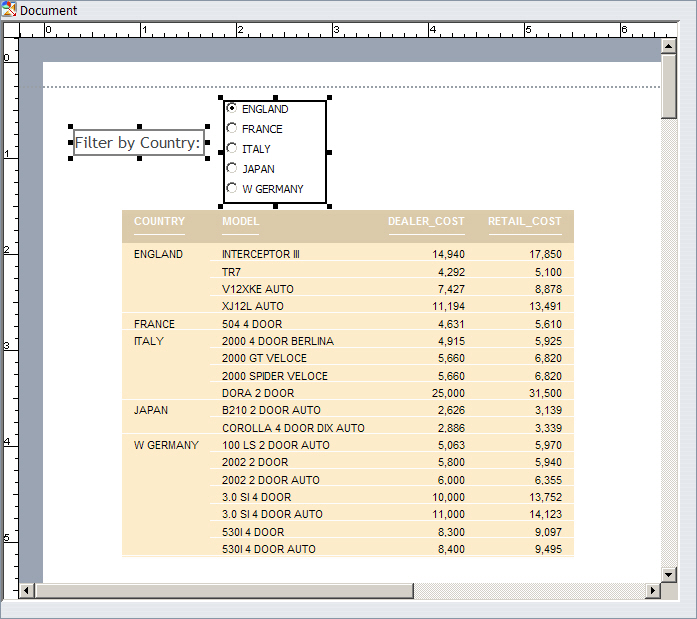
-
Select a
second component by holding the Ctrl key and clicking on a component.
Sizing handles appear around the components, as shown in
the following image.
-
Align the
components using one of the following methods:
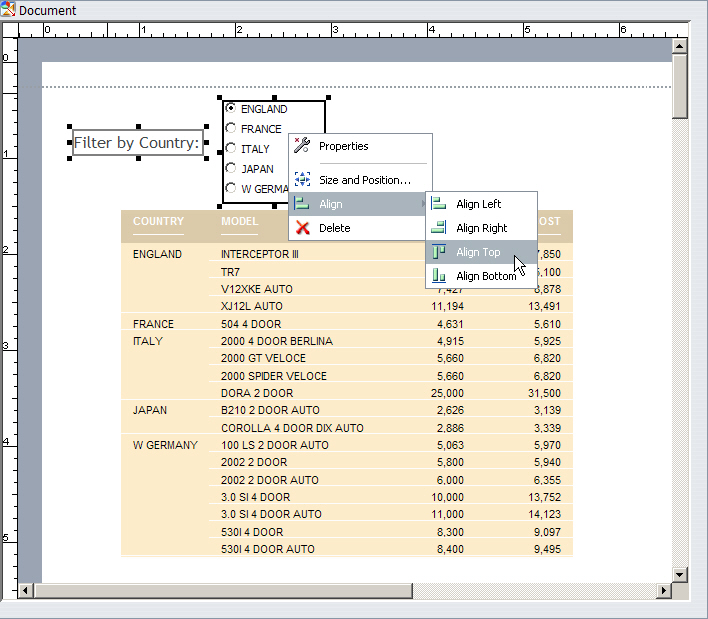
-
Right-click one
of the selected components and select an alignment option from the
Align drop-down menu, as shown in the following image.
or
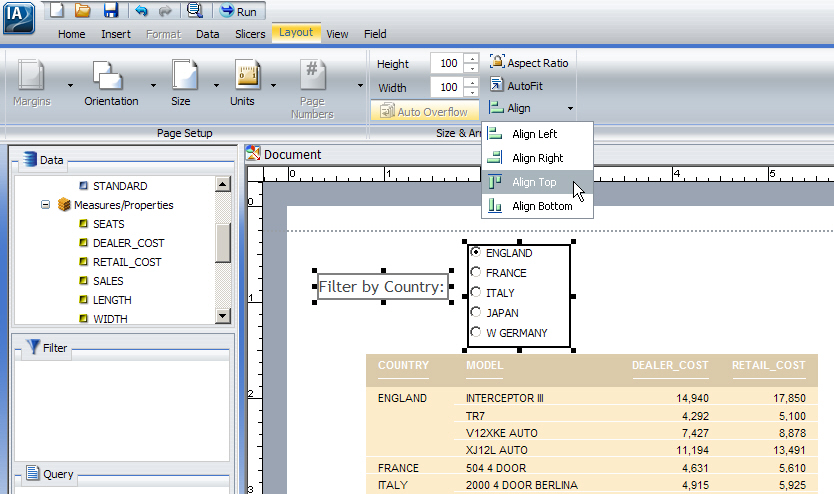
-
Access the alignment
options from the Align drop-down menu available in the Size &
Arrange group of the Layout tab, as shown in the following image.
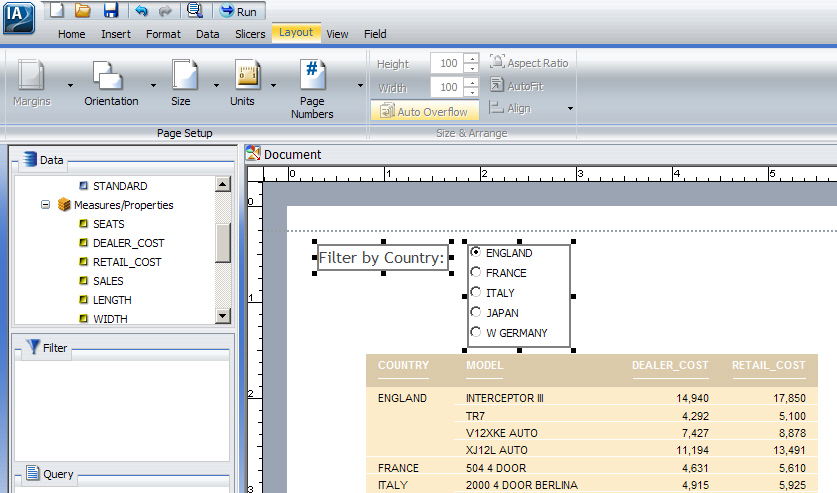
The
selected components will be aligned, as shown in the following image.
x
Procedure: How to Style and Customize a Report
When
you click a component, it enables you to perform functions such
as moving and resizing, as explained in How to Move a Component. After a single click, the Control
Panel can be used to affect all settings of the selected component
except for fields. You can double-click or right-click a component, which
allows you to select individual fields to be edited through the
Context menu or Field tab.
The procedure below applies only
to reports. Charts can be edited and have a context menu that is
covered in How to Style and Customize a Chart. Text can be edited and has a context
menu that is covered in How to Edit Text. Images cannot be edited.
-
Open or
create a compound document with at least one report.
-
Click the
report.
Sizing handles will appear around the border, as shown
in the following image.
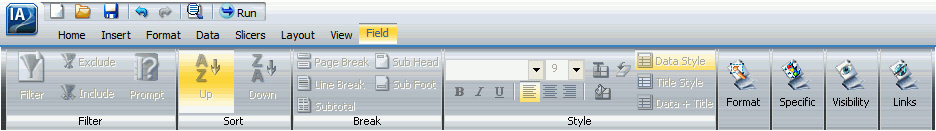
Take
note of the groups on the Field tab. The groups of the Field tab
are still grayed out and inactive, as shown in the following image.
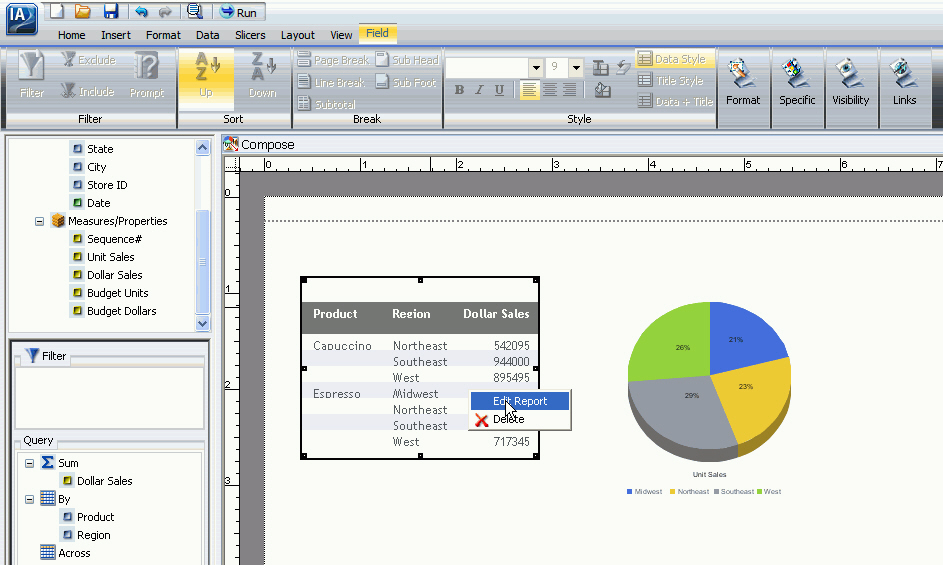
-
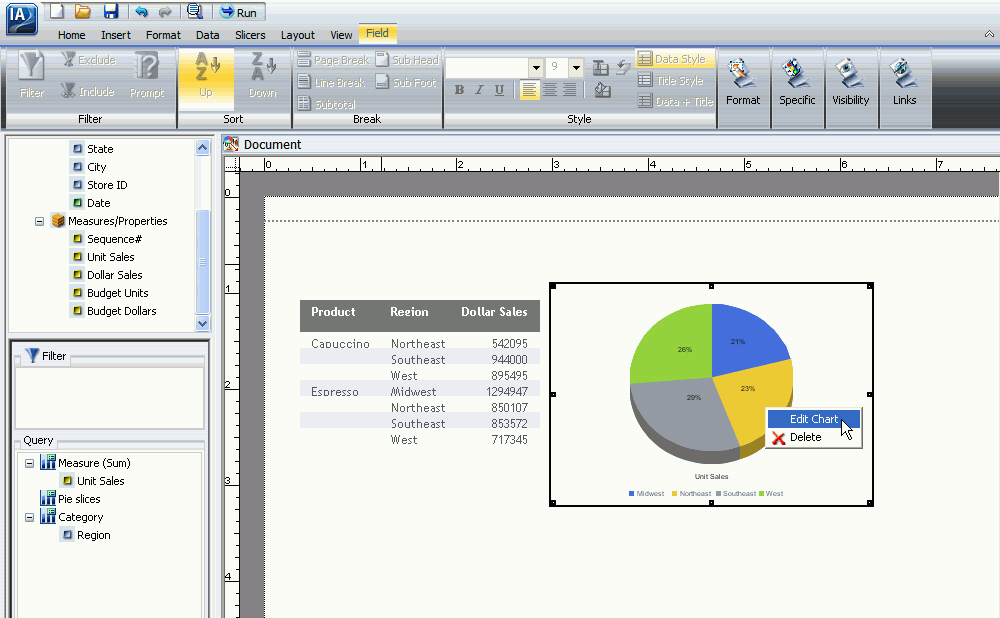
Right-click
the report, and select Edit Report, as shown
in the following image.
Note: You
can also activate the report by double-clicking it, which has the same
functionality as right-clicking and then selecting Edit Report.
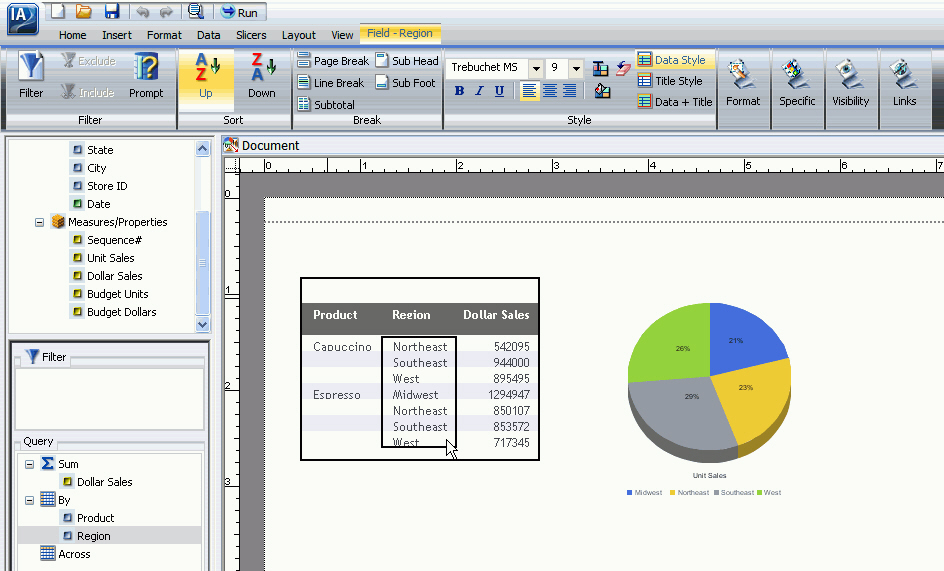
-
You can
now select fields within the report. Select a field by clicking
it in the canvas and take note of the now active groups on the field
tab, as shown in the following image.
Note: You
can also select a field within the report by clicking the field
in the Query pane of the Resources Panel. Make sure that the report
that contains the field you would like to edit is selected on the
canvas.
You can now edit the selected report through right-click
commands, which bring up the Context menu or use of Control Panel,
which contains options similar to those of the Context menu. For
more information on styling and customizing reports, see Customizing and Styling Reports.
x
Procedure: How to Style and Customize a Chart
When
you click a component, it enables you to perform functions such
as moving and resizing, as explained in How to Move a Component. After a single click, the Control
Panel can be used to affect all settings of the selected component
except for fields. You can double-click or right-click a component, which
allows you to select individual fields to be edited through the
Context menu or Field tab.
The procedure below applies only
to charts. Reports can be edited and have a context menu that is
covered in How to Style and Customize a Report. Text can be edited and has a context
menu that is covered in How to Edit Text. Images cannot be edited.
-
Open or
create a compound document with at least one chart.
-
Click the
chart.
Sizing handles appear around the border, as shown in the
following image.
Take
note of the groups on the Field tab. The groups of the Field tab
are still grayed out and inactive, as shown in the following image.
-
Right-click
the chart, and select Edit Chart, as shown
in the following image.
Note: You
can also activate the chart by double-clicking it, which has the same
functionality as right-clicking and then selecting Edit Chart.
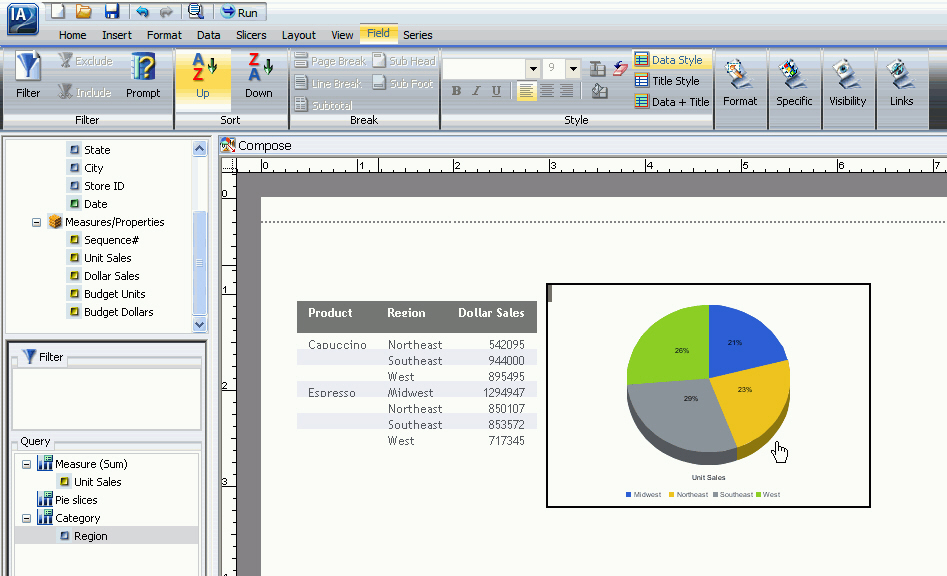
-
You can
now select fields within the chart. Select a field by clicking
it in the canvas and take note of the now active groups on the field
tab, as shown in the following image.
Note: You
can also select a field within the chart by clicking the field in the
Query pane of the Resources Panel. Make sure that the chart that
contains the field you would like to edit is selected on the canvas.
You
can now edit the selected chart through right-click commands, which
bring up the Context menu or use of the Control Panel, which contains
options similar to those of the Context menu. For more information
on styling and customizing charts, see Creating and Customizing Charts.
x
Procedure: How to Edit Text
When
you click a component, you can perform functions such as moving
and resizing, as explained in How to Move a Component. You can double-click or access the
Context menu by right-clicking a component.
The procedure
below applies only to text. Reports can be edited and styled and
have a context menu that is covered in How to Style and Customize a Report. Charts can be edited and styled and
have a context menu that is covered in How to Style and Customize a Chart. Images cannot be edited.
-
Open or
create a compound document with at least one text component.
-
Click the
text.
Sizing handles appear around the border, as shown in the
following image.
-
Right-click
the text, and select Edit Text, as shown
in the following image.
Note: You
can also activate the context menus by double-clicking the text,
which has the same functionality as right-clicking and then selecting Edit
Text.
-
A cursor
appears over the text. Click anywhere in the text box and begin entering
text.
-
Highlight
the text you would like to edit and right-click, a context menu appears.
-
Using the
options in the Context menu, you can style the text and insert quick
text.
The text component menu options are as follows:
|
Value
|
Description
|
Format Options
|
|---|
|
Font
|
Changes the font of the selected text.
|
Not available
|
|
Size
|
Changes the size of the selected text.
|
Not available
|
|
Bold
|
Changes the font weight of the selected
text.
|
Not available
|
|
Italic
|
Applies or removes italics from the selected
text.
|
Not available
|
|
Underline
|
Applies or removes underline from the selected
text.
|
Not available
|
|
Text color...
|
Changes the text color.
|
Not available
|
|
Cut
|
Cuts the selected text.
|
Not available
|
|
Copy
|
Copies the selected text.
|
Not available
|
|
Paste
|
Pastes text from the clipboard.
|
Not available
|
|
Insert date/time
|
Inserts Date or Time quick text with various
format options.
|
- MM/DD/YY
- HH.MM.SS
- MMDDYY
- MMDDYYYY
- DDMMYY
- DDMMYYYY
- YYMMDD
- YYYYMMDD
|
|
Insert page #
|
Inserts page number quick text with various
format options.
|
- Page X
- Total pages
- Page X of Y
|
x
Procedure: How to Delete a Component
The
procedure below applies to all components in the Document view.
-
Open or
create a compound document with at least one component.
-
Right-click
the component, select Delete and the component
will be deleted from the canvas.
Note: You
can also delete a component by clicking it and pressing the Delete
key.
x
Reference: Output Format Options in Compound Documents
A
compound document cannot output in Excel 2007, Excel Pivot, or Excel
Formula format.