In this section: |
You can utilize the custom filtering and aggregation capabilities of the Enable engine along with WebFOCUS integration to display data in Google Maps for multi-dimensional analysis and to provide geographic insight into business trends and opportunities. Google Maps are only available if you have a Google Maps API license key, for more information on obtaining a license key, see Google Maps API License Key.
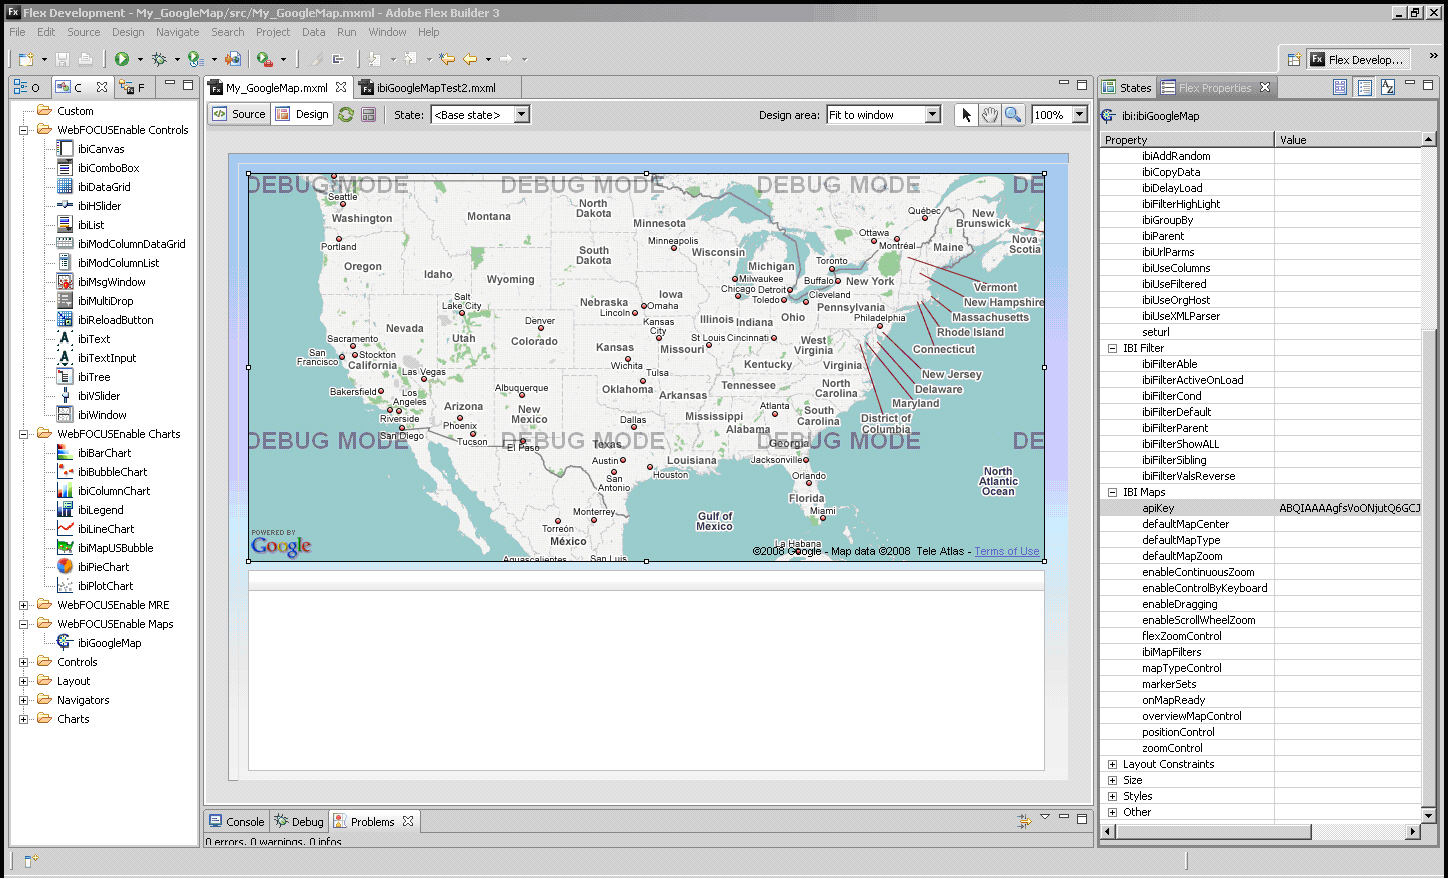
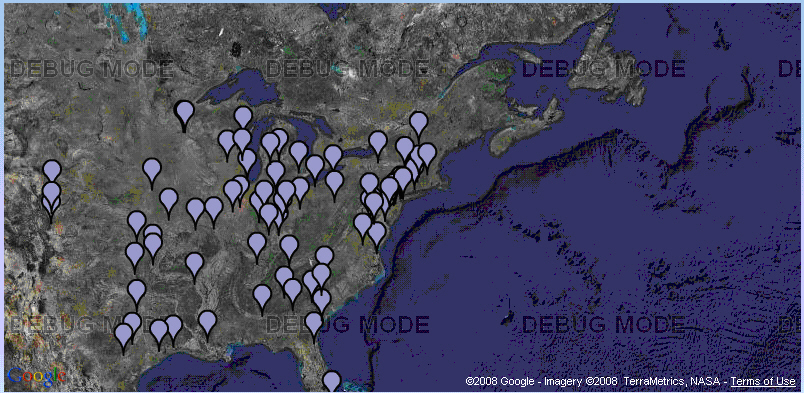
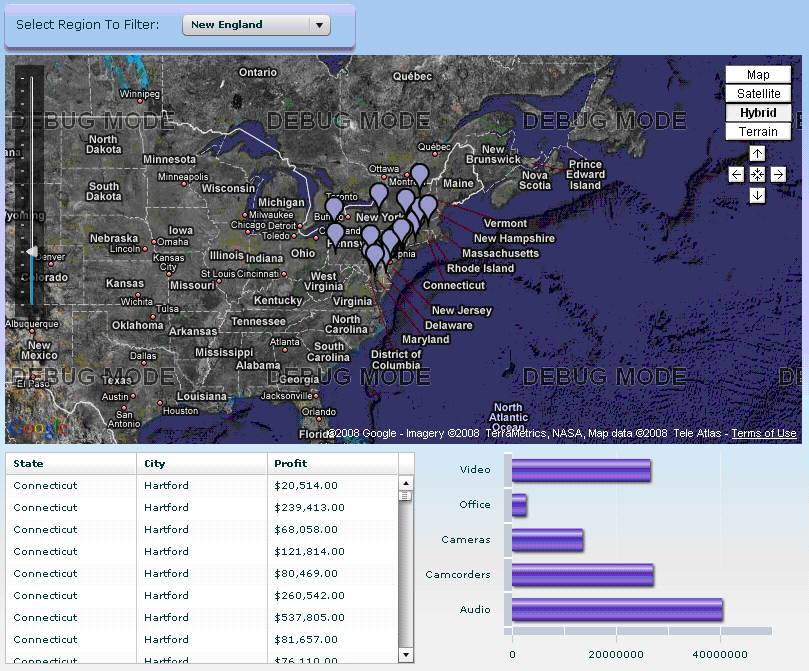
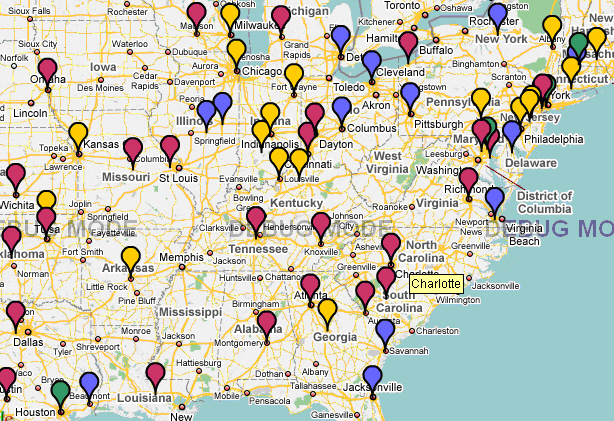
The following image provides an example leveraging Google Maps through WebFOCUS Enable components.
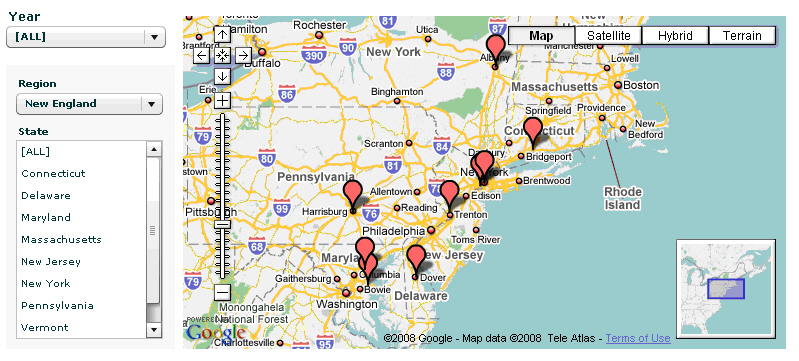
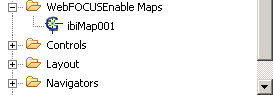
Google Maps is a web-based mapping service application provided by Google offering powerful, user friendly mapping technology that can be customized to show points on a map with drill-down capabilities and allows embedded maps on Flex applications through the Google Maps API for Flash. With Google Maps being a component inside WebFOCUS Enable engine, you can now develop geographical dashboards quickly with advanced visualization, guided navigation, and custom filters. You can customize the Google Maps properties and bind them to the data retrieved from WebFOCUS using WebFOCUS Enable engine. The Google Maps component is available in WebFOCUS Enable Maps folder. For more information on the Google Maps API for Flash, see the documentation located on the Google code site here: http://code.google.com/intl/en/apis/maps/documentation/flash/intro.html.
Note: In order to present points on a map using the data retrieved from WebFOCUS, data needs to be in geocode (enriched with geographical data). When binding data to Google Maps, the sources used to bind WebFOCUS Enable needs to be defined by latitude and longitude coordinates and a Marker value associated with a group of data.
How to: |
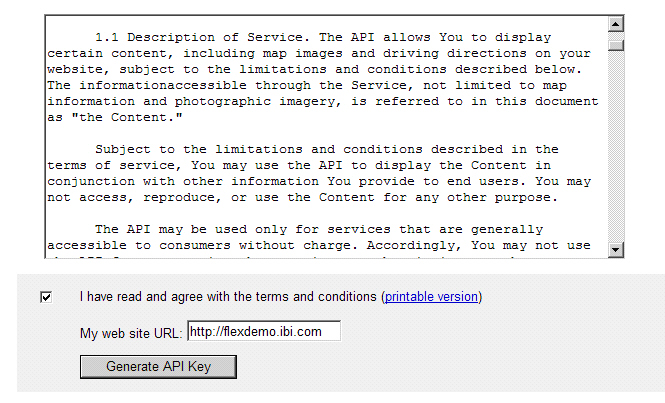
In order to use Google Maps with WebFOCUS Enable, you must sign up for a Google Account and generate a Google Maps API license key.
There is no limit to the number of keys you may obtain under a single Google Account. It is recommend that you register your domain name. Your key will be valid for that domain, its subdomains, all URLs on hosts in those domains, and all ports on those hosts. Make sure it is registered for the domain from which the SWF is being served, not for the domain on which the SWF is embedded.
Note: You must have a Google Account to get a license key. If you do not have an account, create one from http://www.google.com.
http://machine_name.ibi.comThis will work for any URL that starts with machine_name.ibi.com even if the Flex application with the Google Maps will be running under a different port number, for example machine_name.ibi.com:8080.
Note: Do not use localhost.
The Google Map API License key is generated.
Note: ibiCanvas is always required in order to use WebFOCUS Enable components in your Flex application.
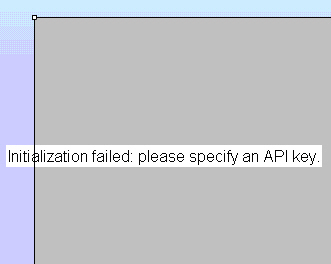
You will see gray box with a message indicating there is no Google Maps API Key assigned to the map.
You should now see the Google Maps in your application.
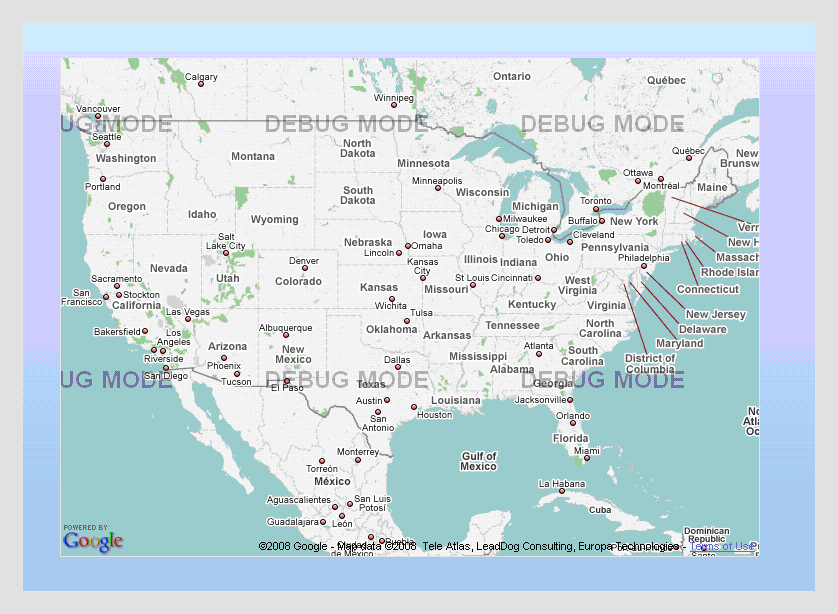
Note: The Debug Mode watermark may appear on the map because while you are developing on a local drive (file://), the Google Maps API Key check is skipped. Once you compile the application and run the SWF file that is Adobe Flash Player compatible under the application or web server where your API Key is registered, the map will run without the Debug Mode message. You may need to register a separate key for your development server machine name while developing the application.
How to: |
You must predefine the marker fields in the source file before binding Google Maps to data using WebFOCUS Enable.
Markers are presented at run time on the Google Map by placing a balloon image at specific geographical points. Clicking on the Google Map marker can result in a drill down report inside an info window that pops up above the marker. A tooltip can also be presented when hovering over a Google Map marker.
Markers are defined by latitude and longitude coordinates that are used to plot points for the marker on the Google Map. You also have the option to specify the fields that contain corresponding data to be used for the tooltips and specify the fields that contain data for drill downs in the info window.
In order to plot points on the Google Map, you must define each point by its latitude and longitude coordinates geographically and associate a marker, or group assignment, to each point. The Source file must be XML format and must contain fields for LATITUDE and LONGITUDE. Additional fields can be included for tooltips or drill down reports in the info window.
Note: The following example creates a source file for a Google Map by:
Once the Latitude and Longitude coordinates for Google Maps have been set, this procedure will be selected as the source file for your application from Flex Builder.
For further instructions on joining the data sources, see How to Join the Century Sales and Locale Data Sources .
For further instructions on how to group fields, see How to Group the COSTOFGOODSSOLD and PROFIT Fields.
For further instructions on adding a filter, see How to Add a Filter to the Report.
Note: The XML output format is available from the Unstyled formats folder.
The Century Sales and Locale data sources are available from the Master Files folder in the IBI Demonstration project of Developer Studio. You can copy these source files to the project directory of your choice.
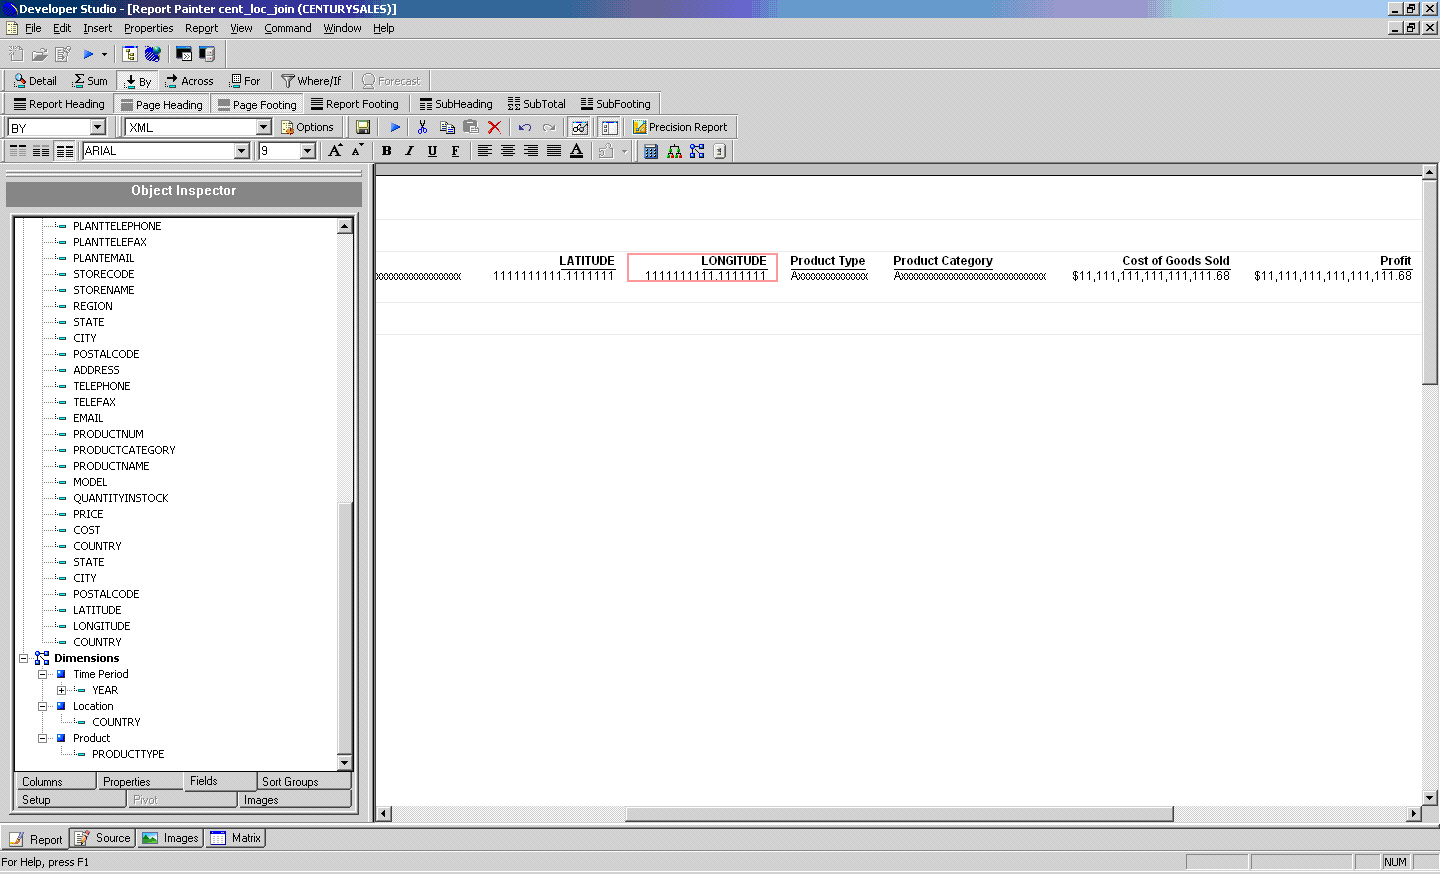
Developer Studio automatically creates a Join between the data sources if they both have fields with the same formats. The Join tool displays both data sources and the default Joins, as shown in the following example image.
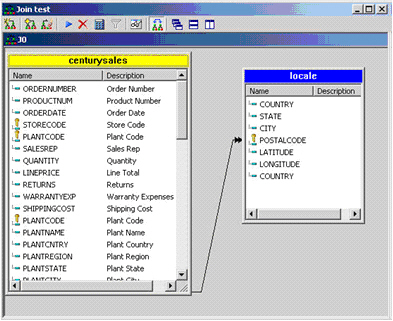
For more information about using the Join tool, see the Creating Reports with Graphical Tools manual.
Note: The LATITUDE and LONGITUDE data are based on CITY so you will assign the CITY field at the tooltips.
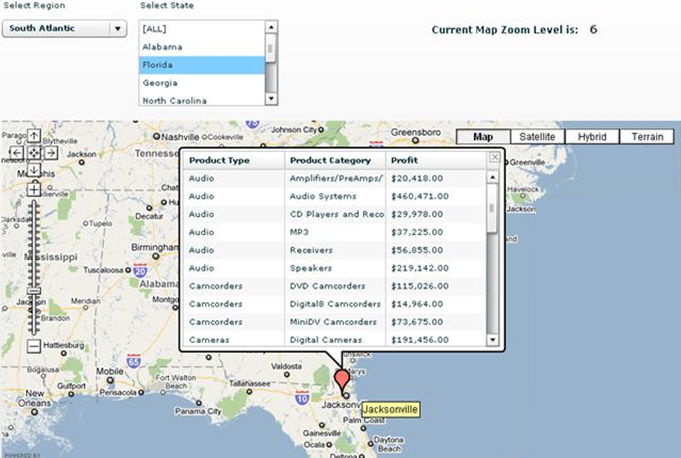
Note: You will drill down into PRODUCTTYPE and PRODUCTCATEGORY data in the info window.
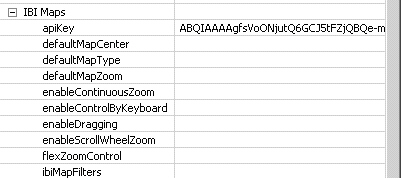
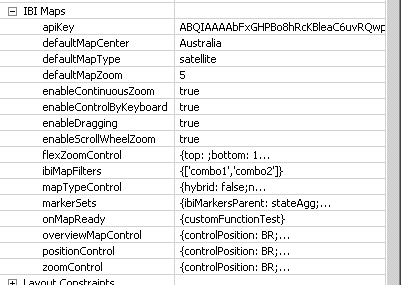
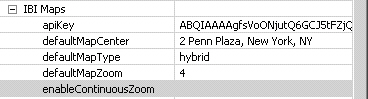
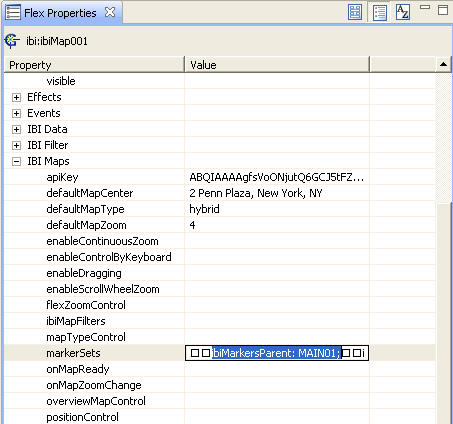
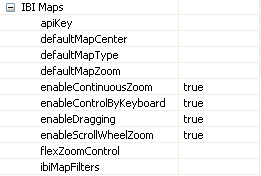
You may customize the Google Maps by using the IBI Maps Properties. The Map properties consist of options for the type, position, and controls available on the Google Map. The settings applied define how the Google Map is initially rendered at run time.
The markerSets property consists of options for binding WebFOCUS data with the Google Map in order to define Google Map Layers and Markers. For a complete list of ibiMap001 component properties, see Mapping Components.
In this section: How to: |
Once you have created a WebFOCUS procedure to retrieve values to populate the marker, you can add the ibiMap001 component to interact with your Flex application.
Adjust the size and position of the canvas as desired.
Adjust the size and position of the data grid as desired.
http://localhost:8080/ibi_apps/WFServlet?IBIF_ex=flexgmap&IBIAPP_app=ibidemo
Note: The above URL points to the flexgmap.fex procedure created in How to Join the Century Sales and Locale Data Sources.
 button.
If prompted, select OK to save and run the
project.
button.
If prompted, select OK to save and run the
project.
Adjust the size and position of the data grid as desired.
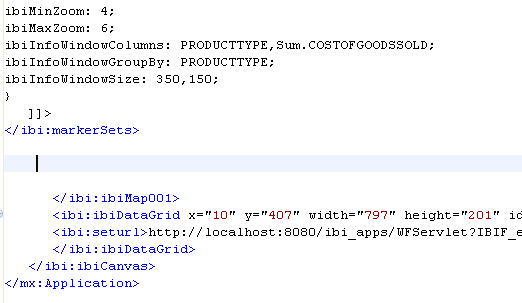
The Google Map appears, as shown below.
Your code should look similar to the following.
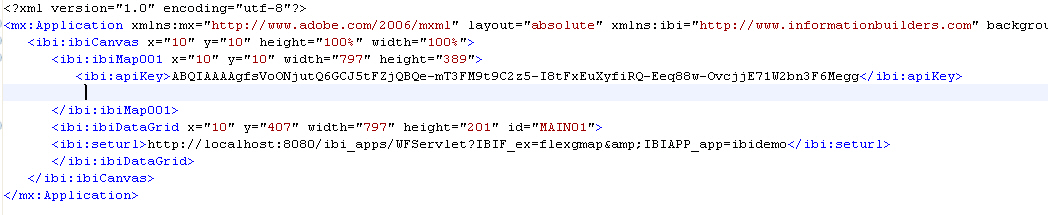
<ibi:markerSets>
<![CDATA[
{
ibiMarkersParent: MAIN01;
ibiMarkerColor: #8F8FBC;
ibiLatColumn: LATITUDE;
ibiLongColumn: LONGITUDE;
ibiToolTip: CITY;
}
]]>
</ibi:markerSets>
button.
If prompted, select OK to save and run the
project.
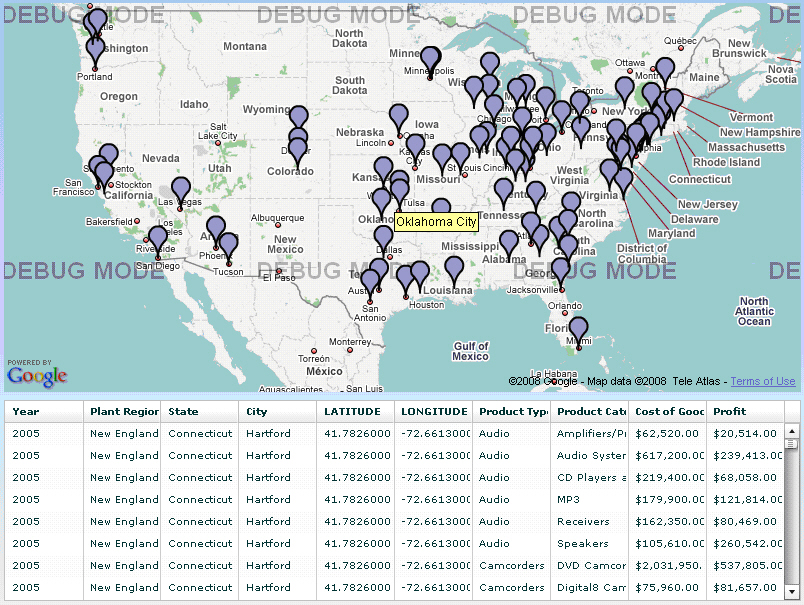
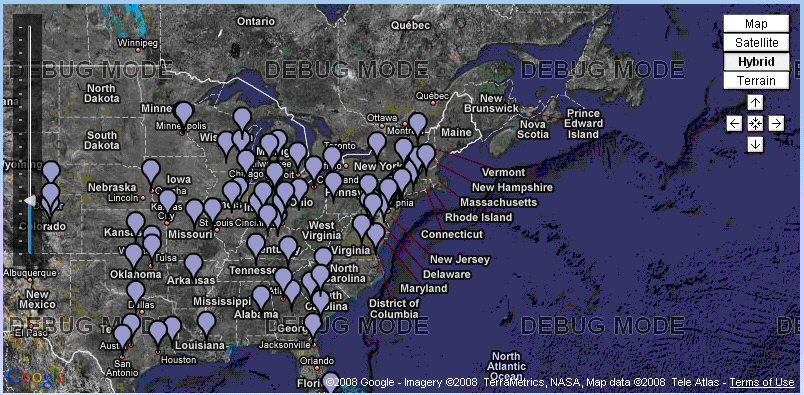
The markers are populated on the map and data tips show the CITY name, as shown below.
Note: The new code is bold.
<ibi:markerSets>
<![CDATA[
{
ibiMarkersParent: MAIN01;
ibiMarkerColor: #8F8FBC;
ibiLatColumn: LATITUDE;
ibiLongColumn: LONGITUDE;
ibiToolTip: CITY;
ibiMinZoom: 4;
ibiMaxZoom: 6;
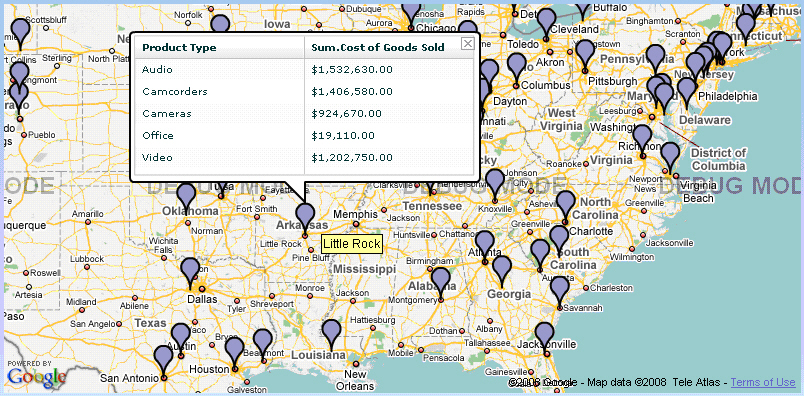
ibiInfoWindowColumns: PRODUCTTYPE,Sum.COSTOFGOODSSOLD;
ibiInfoWindowGroupBy: PRODUCTTYPE;
ibiInfoWindowSize: 350,150;
}
]]>
</ibi:markerSets>
button.
If prompted, select OK to save and run the
project.
You can customize the Google Map views by setting default values and add controls for the users to change settings at runtime.
button.
If prompted, select OK to save and run the
project.
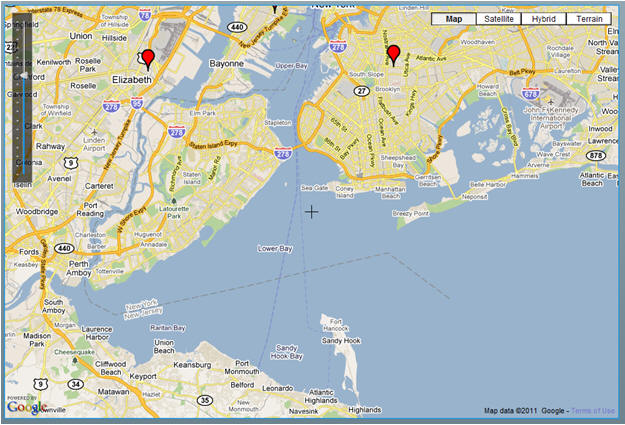
The map is now centered on New York.
<ibi:mapTypeControl>
  <![CDATA[
    {
      buttonAlignment: vertical;
    }
  ]]>
</ibi:mapTypeControl>
<ibi:positionControl>
  <![CDATA[
    {
      controlPosition: TR;
      paddingX: 15;
      paddingY: 90;
    }
  ]]>
</ibi:positionControl>
<ibi:flexZoomControl>
  <![CDATA[
    {
      top: 10;
      left: 10;
    }
  ]]>
</ibi:flexZoomControl>
button.
If prompted, select OK to save and run the
project.
The map will have the new controls added in their specified positions.
Click different types of maps to change the map view or use the arrow icons and the slider to navigate and zoom in and out of the map.
The enableCrosshairs property in the ibiMap001 component, when set to true, places crosshairs (plus sign) on a Google map to mark its center. The default value for the enableCrosshairs property is false.
|
Property |
Description |
|---|---|
|
enableCrosshairs |
True adds crosshairs (plus sign) to a map, marking its center. The default value is False. |
The following image shows the use of the enableCrosshairs property on a Google map.
By default, the map display does not reset when data is reloaded in the ibiMarkersParent grid of the ibiMap001 component. You can use the refreshMapDisplay method of the ibiMap001 component to refresh the map display back to the default settings in the ibiMap001 component properties that were originally specified.
The ibiMap001 component properties reset by calling the refreshMapDisplay method are:
In this example, the map is zoomed to zoom level 15, the map type is set to Hybrid, and NY is set as the map center. At run time, you can change the zoom level and map type, and move the map around within the viewer to change the location of the map.
Clicking the Refresh Map Display button, calls the refreshMapDisplay method and resets the map to its original default view (zoomed to level 15, Hybrid map type, and map centered on NY).
<?xml version="1.0" encoding="utf-8"?>
<mx:Application xmlns:mx="http://www.adobe.com/2006/mxml" layout="absolute"
xmlns:ibi="http://www.informationbuilders.com" >
<ibi:ibiCanvas width="100%" height="100%" id="mycanvas" >
<ibi:ibiDataGrid id="mainGrid" visible="false" width="0" height="0"
seturl="http://localhost:8080/ibi_apps/WFServlet?
IBIF_ex=flexgmall&IBIAPP_app=ibiflexdemo" />
<ibi:ibiMap001
apiKey="ABQIAAAAgfsVoONjutQ6GCJ5tFZjQBQwp_g_
yVhnk3bKMhLuJQbGXMeO3BSLE02tVxsE6RZyZmjjkbrjHH4v6A"
id="map1"
defaultMapZoom="15"
defaultMapCenter="2 Penn Plaza, New York, NY"
defaultMapType="hybrid"
enableContinuousZoom="true"
enableControlByKeyboard="true"
enableScrollWheelZoom="true"
enableCrosshairs="true"
color="#000000" x="53" y="69" width="911" height="613" >
<ibi:markerSets>
<![CDATA[
{
ibiMarkersParent: mainGrid;
ibiMarkerColor: #FF0000;
ibiLatColumn: LATITUDE;
ibiLongColumn: LONGITUDE;
ibiToolTip: STATE;
ibiMinZoom: 1;
ibiMaxZoom: 17;
}
]]>
</ibi:markerSets> <ibi:mapTypeControl>
<![CDATA[
{
}
]]>
</ibi:mapTypeControl>
<ibi:flexZoomControl>
<![CDATA[
{
}
]]>
</ibi:flexZoomControl>
</ibi:ibiMap001>
<mx:Button x="53" y="28" label="Refresh Map Display"
click="map1.refreshMapDisplay()" />
</ibi:ibiCanvas>
</mx:Application>
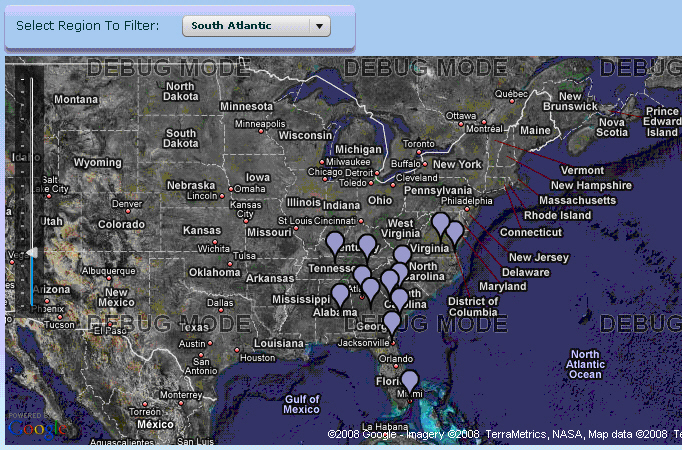
You can apply filters to the map to add interactivity to the map dashboard.
Notice that the ApplicationControlBar resizes automatically.
id: comboReg
This ibiDataGrid will be used for the filter.
id: data01
ibiHideLatLngCols: true;
{['comboReg']}Note: The property expects an array so that multiple filters can be specified. The following is an example of the syntax for more than one filter:
{['comboReg','combo_2','combo_3']}
button.
If prompted, select OK to save and run the
project.
id: bar01
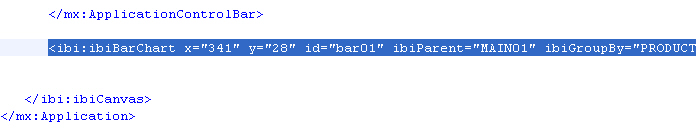
<ibi:ibiBarChart x="341" y="28" id="bar01" ibiParent="MAIN01"
     ibiGroupBy="PRODUCTTYPE" ibiUseFiltered="true" showDataTips="true"
     ibiXField="Sum.PROFIT" ibiYField="PRODUCTTYPE"/>
must be changed to:
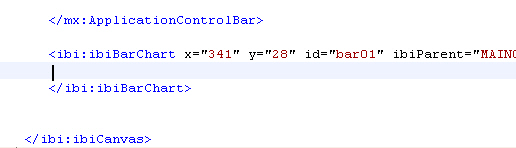
<ibi:ibiBarChart x="341" y="28" id="bar01" ibiParent="MAIN01"
     ibiGroupBy="PRODUCTTYPE" ibiUseFiltered="true" showDataTips="true"
     ibiXField="Sum.PROFIT" ibiYField="PRODUCTTYPE">
 </ibi:ibiBarChart>
 <ibi:ibiBarStyle>
  <![CDATA[
    {
      fillAlphas: 1, 1, 1, 1,1;
      fillRatios: 0,.2,.4,.75,1;
      fillColors: #5a40bc,#c9bbfc,#4930a5,#917ae9,#2b147e;
      fillAngle: 90;
      showDataEffect: zoom;
    }
  ]]>
</ibi:ibiBarStyle>
<mx:Zoom id="zoom" duration="1000"/>
button.
If prompted, select OK to save and run the
project.
The markers, data grid, and the bar chart are now all filterable.
Scale Dependency means only certain layers are visible on the map, depending on the scale or the zoom level at which the map is being displayed. You can populate the markers for different zoom levels based on each aggregation level of the data so that the markers appear and reappear as the user changes the zoom level on the map. You can also add conditions on each aggregated set of data so that the markers appear in different colors based on the condition set.
Note: For this procedure, use locale2.mas and locale2.foc files included in the product download.
The locale2 master and focus files contain individual geocode data for each State, City in a specific state, and Zip code for the specific address in centurysales data. Each geocode value is generated by using free internet service to demonstrate the scale dependent layers of the markers in this example. The fields called ST_LAT and ST_LONG contain corresponding latitude and longitude data for the STATE, CT_LAT and CT_LONG for CITY, and PS_LAT and PS_LONG for POSTALCODE.
JOIN
 CENTURYSALES.STORESEG.POSTALCODE IN centurysales TO MULTIPLE
LOCALE2.SEG01.POSTALCODE
 IN locale2 AS J0
 END
DEFINE FILE CENTURYSALES
MONTHNAME/A20=IF MONTH EQ '01' THEN 'January'
ELSE IF MONTH EQ '02' THEN 'February'
ELSE IF MONTH EQ '03' THEN 'March'
ELSE IF MONTH EQ '04' THEN 'April'
ELSE IF MONTH EQ '05' THEN 'May'
ELSE IF MONTH EQ '06' THEN 'June'
ELSE IF MONTH EQ '07' THEN 'July'
ELSE IF MONTH EQ '08' THEN 'August'
ELSE IF MONTH EQ '09' THEN 'September'
ELSE IF MONTH EQ '10' THEN 'October'
ELSE IF MONTH EQ '11' THEN 'November'
ELSE IF MONTH EQ '12' THEN 'December'
;
END
TABLE FILE CENTURYSALES
SUM
  PRODUCTCATEGORY
  COST
  PRICE
  COSTOFGOODSSOLD
  PROFIT
BY YEAR
BY QUARTER
BY MONTH
BY MONTHNAME
BY PLANTREGION
BY STATE
BY ST_LAT
BY ST_LONG
BY CITY
BY CT_LAT
BY CT_LONG
BY POSTALCODE
BY PS_LAT
BY PS_LONG
BY STORENAME
BY ADDRESS
BY PRODUCTTYPE
WHERE ( COUNTRY EQ 'United States' ) AND ( REGION NE 'Web(R)' )
  AND ( POSTALCODE NE '065208332' OR '672033296' OR '941033185' );
ON TABLE SET PAGE-NUM OFF
ON TABLE NOTOTAL
ON TABLE PCHOLD FORMAT XML
ON TABLE SET HTMLCSS ON
END
Adjust the size and position of the canvas as desired.
Adjust the size and position of the data grid as desired.
http://localhost:8080/ibi_apps/WFServlet?IBIF_ex=localeall&IBIAPP_app=ibidemo
Note: The above URL points to the localeall.fex procedure created in step 1 through step 4.
<ibi:markerSets>
  <![CDATA[
    {
      ibiMarkersParent: stateAgg;
      ibiLatColumn: ST_LAT;
      ibiLongColumn: ST_LONG;
      ibiToolTip: STATE;
      ibiMinZoom: 3;
      ibiMaxZoom: 4;
      ibiInfoWindowColumns: PRODUCTTYPE,Sum.PROFIT;
      ibiInfoWindowGroupBy: PRODUCTTYPE;
      ibiInfoWindowSize: 250,150;
      ibiMarkerCenter: true;
      ibiHideLatLngCols: true;
      ibiVisRanges: 1000000.00,5000000.00,10000000.00;
      ibiVisColors: red,yellow,blue,green;
      ibiVisColumn: Sum.PROFIT;
    }
  ]]>
</ibi:markerSets>
Instead of setting marker color using the ibiMarkerColor property, it is set using the ibiVisRanges, ibiVisColors, and ibiVisColumn properties (bold above). For more information on these properties, see Mapping Components.
button.
If prompted, select OK to save and run the
project.
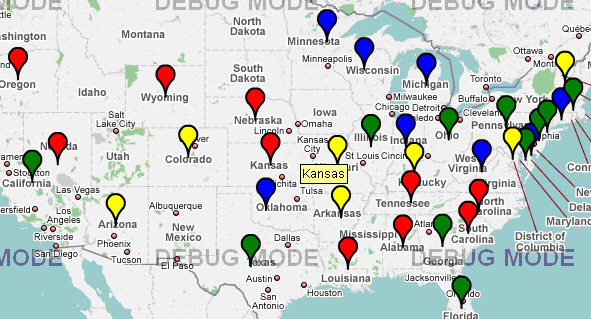
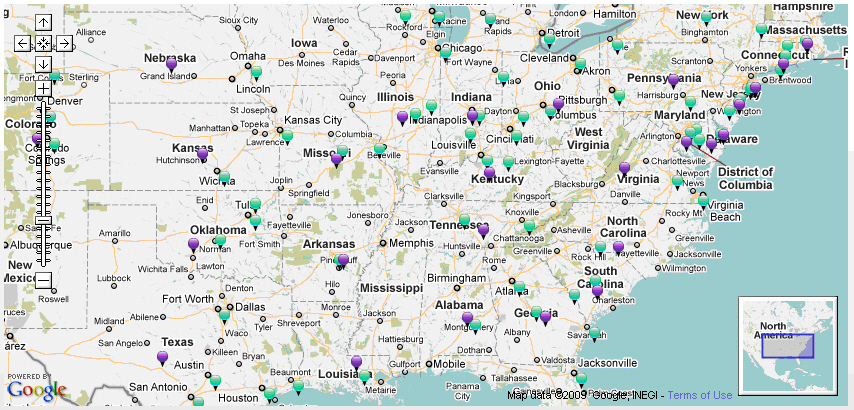
The map is now populated by red, blue, yellow, and green markers with the data tip for STATE.
Note: Each marker set inside the CDATA section of <ibi:markerSets> should be separated by a comma after the brackets { } of the previous marker set.
{
  ibiMarkersParent: cityAgg;
  ibiLatColumn: CT_LAT;
  ibiLongColumn: CT_LONG;
  ibiToolTip: CITY;
  ibiMinZoom: 5;
  ibiMaxZoom: 6;
  ibiInfoWindowColumns: PRODUCTTYPE,PRODUCTCATEGORY,Sum.PROFIT;
  ibiInfoWindowGroupBy: PRODUCTTYPE,PRODUCTCATEGORY;
  ibiInfoWindowSize: 400,300;
  ibiVisRanges: 1000000.00,5000000.00,10000000.00;
  ibiVisColors: #CA226B,#FDD017,#6960EC,#4E9258;
  ibiVisColumn: Sum.PROFIT;
  ibiMarkerCenter: true;
  ibiHideLatLngCols: true;
}
button.
If prompted, select OK to save and run the
project.
Note: Each marker set inside the CDATA section of <ibi:markerSets> should be separated by a comma after the brackets { } of the previous marker set.
{
  ibiMarkersParent: postData;
  ibiLatColumn: PS_LAT;
  ibiLongColumn: PS_LONG;
  ibiToolTip: POSTALCODE;
  ibiMinZoom: 7;
  ibiMaxZoom: 8;
  ibiInfoWindowColumns: PRODUCTCATEGORY,PROFIT;
  ibiInfoWindowSize: 400,300;
  ibiVisRanges: 10000.00,50000.00,100000.00;
  ibiVisColors: #F5A9A9,#F4FA58,#58ACFA,#01DF74;
  ibiVisColumn: PROFIT;
  ibiMarkerCenter: true;
  ibiHideLatLngCols: true;
}
button.
If prompted, select OK to save and run the
project.
Below is the sample code for the map with scale dependent layers and visualizations created in How to Add Scale Dependent Layers and Visualizations to Markers using ibiMap001, with additional map controls and combo boxes for filtering data on the map.
<?xml version="1.0" encoding="utf-8"?>
<mx:Application xmlns:mx="http://www.adobe.com/2006/mxml" layout="absolute"
    xmlns:ibi="http://www.informationbuilders.com" backgroundColor="#ffffff">
  <ibi:ibiCanvas width="100%" height="100%" id="mycanvas" y="10" x="10" >
    <ibi:ibiDataGrid x="0" y="448" width="800" height="133"
         id="mainGrid"
         seturl="http://localhost:8080/ibi_apps/WFServlet?IBIF_ex=localeall"
         visible="false"/>
    <mx:Label text="Region: " fontSize="12" width="57" x="10" y="11"/>
    <ibi:ibiComboBox x="66" y="11" width="180"
         id="combo1"
         ibiParent="mainGrid"
         ibiColumn="PLANTREGION"
         ibiFilterAble="true" />
    <mx:Label text="State: " fontSize="12" width="50" x="320" y="11"/>
<ibi:ibiComboBox width="180" x="368" y="11"
id="combo2"
ibiParent="mainGrid"
ibiColumn="STATE"
ibiFilterAble="true"
ibiFilterParent="combo1"
ibiSortValues="true" />
<ibi:ibiDataGrid width="257" height="134" y="505" x="10"
id="stateAgg"
ibiParent="mainGrid"
ibiGroupBy="STATE,ST_LAT,ST_LONG"
ibiUseColumns="STATE,ST_LAT,ST_LONG,Sum.PROFIT"
ibiUseFiltered="true" />
<ibi:ibiDataGrid x="275" y="505" width="257" height="133"
id="cityAgg"
ibiParent="mainGrid"
ibiGroupBy="CITY,CT_LAT,CT_LONG"
ibiUseColumns="CITY,CT_LAT,CT_LONG,Sum.PROFIT"
ibiUseFiltered="true" /> <ibi:ibiDataGrid x="540" y="505" width="260" height="133"
id="postData"
ibiParent="mainGrid"
ibiUseColumns="POSTALCODE,PS_LAT,PS_LONG,PROFIT"
ibiUseFiltered="true"
visible="true" />
<ibi:ibiMap001 id="map1" width="790" height="456" left="10" top="41"
apiKey="ABQIAAAAgfsVoONjutQ6GCJ5tFZjQBQe-mT3FM9t9C2z5-
I8tFxEuXyfiRQ-Eeq88w-OvcjjE71W2bn3F6Megg"
enableScrollWheelZoom="true"
enableContinuousZoom="true"
enableDragging="true"
enableControlByKeyboard="true"
ibiMapFilters="{['combo1','combo2']}" >
<ibi:markerSets>
<![CDATA[
{
ibiMarkersParent: stateAgg;
ibiMarkerColor: ;
ibiLatColumn: ST_LAT;
ibiLongColumn: ST_LONG;
ibiToolTip: STATE;
ibiMinZoom: 3;
ibiMaxZoom: 4;
ibiInfoWindowColumns: PRODUCTTYPE,Sum.PROFIT;
ibiInfoWindowGroupBy: PRODUCTTYPE;
ibiInfoWindowSize: 250,150;
ibiVisRanges: 1000000.00,5000000.00,10000000.00;
ibiVisColors: red,yellow,blue,green;
ibiVisColumn: Sum.PROFIT;
ibiMarkerCenter: true;
ibiHideLatLngCols: true;
},
{
ibiMarkersParent: cityAgg;
ibiMarkerColor: ;
ibiLatColumn: CT_LAT;
ibiLongColumn: CT_LONG;
ibiToolTip: CITY;
ibiMinZoom: 5;
ibiMaxZoom: 6;
ibiInfoWindowColumns: PRODUCTTYPE,PRODUCTCATEGORY,Sum.PROFIT;
ibiInfoWindowGroupBy: PRODUCTTYPE,PRODUCTCATEGORY;
ibiInfoWindowSize: 400,300;
ibiVisRanges: 1000000.00,5000000.00,10000000.00;
ibiVisColors: #CA226B,#FDD017,#6960EC,#4E9258;
ibiVisColumn: Sum.PROFIT;
ibiMarkerCenter: true;
ibiHideLatLngCols: true;
},
{
ibiMarkersParent: postData;
ibiMarkerColor: ;
ibiLatColumn: PS_LAT;
ibiLongColumn: PS_LONG;
ibiToolTip: POSTALCODE;
ibiMinZoom: 7;
ibiMaxZoom: 8;
ibiInfoWindowColumns: PRODUCTCATEGORY,PROFIT;
ibiInfoWindowGroupBy: ;
ibiInfoWindowSize: 400,300;
ibiVisRanges: 10000.00,50000.00,100000.00;
ibiVisColors: #F5A9A9,#F4FA58,#58ACFA,#01DF74;
ibiVisColumn: PROFIT;
ibiMarkerCenter: true;
ibiHideLatLngCols: true;
}
]]>
</ibi:markerSets>
<ibi:flexZoomControl>
<![CDATA[
{
top: ;
bottom: 35;
right: ;
left: 10;
animate: false;
}
]]>
</ibi:flexZoomControl>
<ibi:positionControl>
<![CDATA[
{
controlPosition: BR;
paddingX: 10;
paddingY: 110;
}
]]>
</ibi:positionControl>
<ibi:mapTypeControl>
<![CDATA[
{
hybrid: false;
normal: true;
physical: false;
satellite: true;
controlPosition: TR;
paddingX: 10;
paddingY: 10;
buttonAlignment: vertical;
buttonSizeWidth: 67;
buttonSizeHeight: 19;
}
]]>
</ibi:mapTypeControl>
<ibi:overviewMapControl>
<![CDATA[
{
controlPosition: BR;
paddingX: 0;
paddingY: 0;
}
]]>
</ibi:overviewMapControl>
</ibi:ibiMap001>
</ibi:ibiCanvas>
</mx:Application>
You can specify your own custom images to be used for the marker icons and replace the Google Maps marker images.
The image file has to be embedded into the application using Embed source function. The image files should be embedded and defined as class files in the script as follows.
[Embed(source=" bluepin.png")]
public var assign_class_name:Class;
For example:
public var blueClassName:Class;
or
private var assign_class_name:Class;For example:
private var blueClassName:Class;
When the image file is declared as a PUBLIC class, you can call the image class name directly using ibiMarkerIcon property within markerSets property, as shown in the following code.
ibiMarkerIcon: assign_class_name;For example:
ibiMarkerIcon: blueClassName;
When the image is declared as a PRIVATE class, first you need to define it in the ibiCustomMarkerIcons property in the ibiMap001 component using an array format, as shown in the following code.
ibiCustomMarkerIcons="{{'assign_image_name':image_class_name_defined, … }}"For example:
<ibi:ibiMap001 …
ibiCustomMarkerIcons="{{'bluePinName':blueClassName,'greenPinName':greenClassName}}"
Then you can call the image name assigned in ibiCustomMarkerIcons property using ibiMarkerIcon property within markerSets property.
ibiMarkerIcon: image_name_assigned;For example:
ibiMarkerIcon: bluePinName;
If the image name or class name does not exist then the default Google Maps marker icons are displayed over the map instead.
The following six image files are defined to be embedded into the application.
<mx:Script>
 <![CDATA[
  [Embed(source="bluepin.png")]
     private var blueClassName:Class;

     [Embed(source="greenpin.png")]
     private var greenClassName:Class;

     [Embed(source="pinkpin.png")]
     private var pinkClassName:Class;

     [Embed(source="purplepin.png")]
     public var purpleClassName:Class;

     [Embed(source="redpin.png")]
     public var redClassName:Class;

     [Embed(source="yellowpin.png")]
     public var yellowClassName:Class;

 ]]>
</mx:Script>
The images, bluepin.png, greenpin.png, and pinkpin.png files, are defined as private classes. You need to assign image names to the private class files using the ibiCustomMarkerIcons property. Then the image file names can be accessed from the ibiMarkerIcon property in markerSets.
The images, purplepin.png, redpin.png, and yellowpin.png files, are defined as public classes. The class name can be referenced directly from the ibiMarkerIcon property in markerSets.
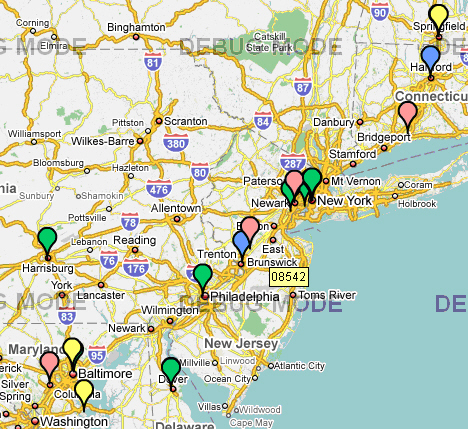
One of the image file referenced in ibiMarkerIcon property is missing in this example, so it is replaced by the default Google Maps marker image.
<ibi:ibiMap001 x="10" y="40" height="402" width="844"
     id="map01" defaultMapZoom="3"
     ibiMapFilters="{['comboReg','comboSt','comboCity']}"
     ibiCustomMarkerIcons="{{
       'bluePinName':blueClassName,
       'greenPinName':greenClassName,
       'pinkPinName':pinkClassName
     }}"
     enableContinuousZoom="true"
     enableControlByKeyboard="true"
     enableDragging="true"
     enableScrollWheelZoom="true" >
<ibi:apiKey>ABQIAAAAgfsVoONjutQ6GCJ5tFZjQBQe-
mT3FM9t9C2z5-I8tFxEuXyfiRQ-Eeq88w-OvcjjE71W2bn3F6Megg
</ibi:apiKey>
<ibi:markerSets>
<![CDATA[
{
ibiMarkersParent: main01;
ibiLatColumn: ST_LAT;
ibiLongColumn: ST_LONG;
ibiToolTip: STATE;
ibiMinZoom: 3;
ibiMaxZoom: 4;
ibiMarkerIcon: bluePinName;
}, {
ibiMarkersParent: main01;
ibiLatColumn: ST_LAT;
ibiLongColumn: ST_LONG;
ibiToolTip: STATE;
ibiMinZoom: 4;
ibiMaxZoom: 5;
ibiMarkerIcon: purpleClassName;
ibiInfoWindowGroupBy: PRODUCTTYPE;
ibiInfoWindowColumns: PRODUCTTYPE,Sum.PROFIT;
},
{
ibiMarkersParent: main01;
ibiLatColumn: CT_LAT;
ibiLongColumn: CT_LONG;
ibiToolTip: CITY;
ibiMinZoom: 5;
ibiMaxZoom: 6;
ibiMarkerIcon: greenPinName;
ibiInfoWindowGroupBy: PRODUCTCATEGORY;
ibiInfoWindowColumns: PRODUCTCATEGORY,Sum.PROFIT;
}, {
ibiMarkersParent: main01;
ibiLatColumn: CT_LAT;
ibiLongColumn: CT_LONG;
ibiToolTip: POSTALCODE;
ibiMinZoom: 6;
ibiMaxZoom: 7;
ibiMarkerIcon: noPin;
}, {
ibiMarkersParent: main01;
ibiLatColumn: PS_LAT;
ibiLongColumn: PS_LONG;
ibiToolTip: POSTALCODE;
ibiMinZoom: 7;
ibiMaxZoom: 8;
ibiMarkerIcon: redClassName;
}
]]>
</ibi:markerSets>
<ibi:zoomControl>
<![CDATA[
{
}
]]>
</ibi:zoomControl>
<ibi:mapTypeControl>
<![CDATA[
{
}
]]>
</ibi:mapTypeControl> <ibi:overviewMapControl>
<![CDATA[
{
}
]]>
</ibi:overviewMapControl>
<ibi:positionControl>
<![CDATA[
{
}
]]>
</ibi:positionControl>
</ibi:ibiMap001>The following image shows the output.
You can call custom user defined functions using the ibiOnMarkerClick property and onMapZoomChange property when using ibiMap001. For example, you can add drill downs to WebFOCUS reports when the marker is clicked or when the map zoom level has been changed. The event itself has to be manually coded in the Script section of the source code using ActionScript.
The ibiOnMarkerClick property is used to run a custom event when the user clicks on the marker. Currently if the info window options in the markerSets property are set, info window opens when the user clicks on the marker by default. You can have info window pop up and run a custom event when the marker is clicked. The info window can be turned off by not setting info window options in the markerSets property.
The onMapZoomChange property is used to run a custom event when the map zoom level is changed.
In the following example, the markerClicked function is defined to run a WebFOCUS report as a drill down procedure. The report should contain filtered result based on the location of the marker clicked. The LATITUDE and LONGITUDE information of the marker is sent to the procedure as parameters. Also zoomChanged is used to display the current zoom level of the map in the application.
<mx:Script>
<![CDATA[
import com.google.maps.MapMouseEvent;
private function markerClicked(e:MapMouseEvent):void
{
var fexString:String = "";
var drillpath:String = "http://localhost:8080/ibi_apps/WFServlet
?IBIF_ex=city_sales&IBIAPP_app=ibiflexdemo";
fexString = drillpath +
"&LATITUDE =" + e.latLng.lat().toString() +
"&LONGITUDE =" + e.latLng.lng().toString();
navigateToURL(new URLRequest(fexString), '_blank');
}
import com.google.maps.MapZoomEvent;
private function zoomChanged(e:MapZoomEvent):void
{
info.text = map01.mapContainer.getZoom().toString();
}
]]>
</mx:Script>The map calls markerClicked and zoomChanged functions in the ibiOnMarkerClick and onMapZoomChange properties.
<ibi:ibiMap001 x="10" y="162" height="440" width="836" id="map01"
defaultMapZoom="5" ibiMapFilters="{['comboReg','listSt']}"
ibiOnMarkerClick="{markerClicked}"
onMapZoomChange="{zoomChanged}"
enableContinuousZoom="true" enableControlByKeyboard="true"
enableDragging="true" enableScrollWheelZoom="true" >
<ibi:apiKey>ABQIAAAAgfsVoONjutQ6GCJ5tFZjQBQe-mT3FM9t9C2z5-
I8tFxEuXyfiRQ-Eeq88w-OvcjjE71W2bn3F6Megg
</ibi:apiKey>
<ibi:markerSets>
<![CDATA[
{
ibiMarkersParent: main01;
ibiLatColumn: LATITUDE;
ibiLongColumn: LONGITUDE;
ibiToolTip: CITY;
ibiMinZoom: 2;
ibiMaxZoom: 8;
ibiInfoWindowColumns: PRODUCTTYPE,PRODUCTCATEGORY,PROFIT;
}
]]>
</ibi:markerSets>
<ibi:zoomControl>
<![CDATA[
{
}
]]>
</ibi:zoomControl>
<ibi:mapTypeControl>
<![CDATA[
{
}
]]>
</ibi:mapTypeControl>
  <ibi:overviewMapControl>
    <![CDATA[
      {
      }
    ]]>
  </ibi:overviewMapControl>
  <ibi:positionControl>
    <![CDATA[
      {
      }
    ]]>
  </ibi:positionControl>
</ibi:ibiMap001>
The map and marker are shown in the following image.
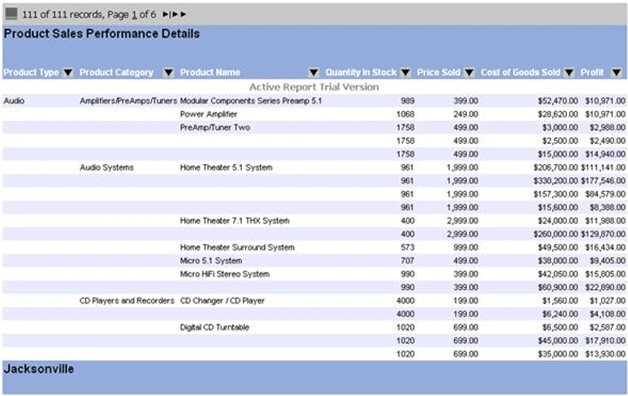
When the marker is clicked, WebFOCUS active report opens with the filtered data for the location clicked. In this case, Jacksonville, Florida, as shown in the following image.
The component called ibiMapCenterControl is available in the WebFOCUSEnable Maps folder to center the map and change the zoom level automatically based on the values selected in ibiComboBox and ibiList components.
You can drag and drop the ibiMapCenterControl component anywhere outside of the ibiMap001 component. The following properties are available in ibiMapCenterControl component.
|
Property |
Description |
|---|---|
|
ibiComponentID |
Required. Set the ID of the combo box or list box or data grid that will be used to move the map. |
|
ibiMapParent |
Required. Specify the ID of the map component to center and zoom. |
|
ibiMapLatCol |
Required. Specify the column name that contains Latitude values to direct the map. |
|
ibiMapLongCol |
Required. Specify the column name that contains Longitude values to direct the map. |
|
ibiMapCenterAll |
Optional. Specify where to center the map when the value [ALL] is selected in the combo box or list box. This property can be a name of the Country, State, City, or an address or a specific Latitude/Longitude value separated by comma or space. For example, ibiMapCenterAll="Australia" or ibiMapCenterAll="Memphis, KY" or ibiMapCenterAll="35.22, 138.44" If nothing is set, the map will not move and stays at the last location it was directed. |
|
ibiMapZoomLevel |
Optional. Specify the zoom level to direct the map to zoom in and/or out based on the value selected in the combo box or list box. If nothing is set, the map stays at the last zoom level used. |
Using the ibiComboBox named combo1, the user is able to select a value from the field such as REGION, and the map will move to the location selected based on the corresponding values in LATITUDE and LONGITUDE columns. The map will also zoom into level 5. The map will center its location to New York when the user selects the value [ALL] from the combo box.
<ibi:ibiMapCenterControl x="964" y="70"
 ibiComponentID="combo1"
 ibiMapLatCol="LATITUDE"
 ibiMapLongCol="LONGITUDE"
 ibiMapParent="map1"
 ibiMapZoomLevel="5"
 ibiMapCenterAll="2 Penn Plaza, New York, NY" >
</ibi:ibiMapCenterControl>
| WebFOCUS |