Preparing the Layout and Adding the Charts

How to:

First you will prepare the layout for the four additional charts using Flex layout components. Then you will add a bar chart, line chart, plot chart, and bubble chart to the sample application using Information Builders components.


Top of page

x
Procedure: How to Prepare the Layout
  1. Create another tab named Other Charts using the instructions in Logically Organizing Content With the TabNavigator.
  2. To position the new tab (Other Charts) immediately after the first tab (Grids, Filters, Charts), select the first tab and then click the plus sign (+) on the TabNavigator control. A new tab is positioned immediately after a selected tab.
  3. Set the width of the tab canvas to 900px. By default, the width of the tab canvas is set to match the width of the window, which causes a chart to stretch in order to fill the entire window width. Setting a fixed width for our four charts ensures the best display.
  4. To divide the tab canvas horizontally into two sections, insert an HDividerBox. Drag the component and align it with the top left section of the canvas. When you release the mouse button (that is, when you drop the component), a pop-up dialog box appears, prompting you for the size of the HDividerBox relative to the tab canvas.
  5. Set Width to 900px, and Height to 48% (or 240px). Later you will position two other charts below.

Top of page

x
Procedure: How to Create a Bar Chart
  1. Insert an ibiBarChart onto the canvas.
  2. Set the following properties:
    • id=subbar01
    • ibiGroupBy=CATEGORY
    • ibiParent=MAIN01
    • ibiXField=Sum.DOLLARS,Sum.UNITS. This property displays two measures.
    • ibiYField=CATEGORY
    • ibiUseFiltered=true
    • Width=330px
    • Height=228px

    You can adjust the width and height of the chart by dragging its sides.


Top of page

x
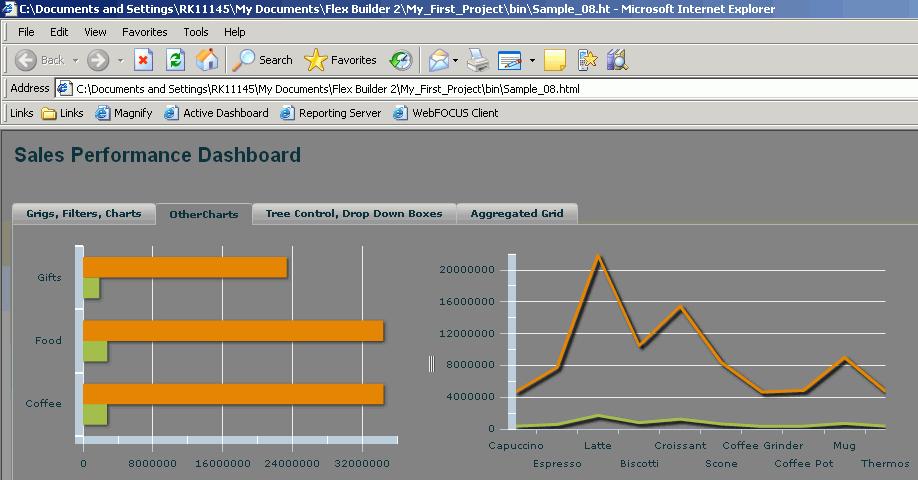
Procedure: How to Create a Line Chart
  1. Insert an ibiLineChart onto the canvas to the right of the bar chart.
  2. Set the following properties:
    • id=subline01
    • ibiGroupBy=PRODUCT
    • ibiParent=MAIN01
    • ibiXField=PRODUCT
    • ibiYField=Sum.DOLLARS,Sum.UNITS
    • ibiUseFiltered=true
    • Width=330px
    • Height=228px
  3. Run the application.

    Notice that the hDividerBox has a slider between the two charts. You can click on it and drag it right or left. The width of the chart is automatically adjusted to fill the space.

    hDividerBox slider


Top of page

x
Procedure: How to Create a Plot Chart
  1. Insert a second hDividerBox and drag it so that it is aligned left and below the first hDividerBox. Guidelines appear when it is aligned. When you release the mouse button, the box will snap to the guidelines.
  2. The pop-up dialog box that appears contains the dimensions of the first (upper) hDividerBox, so just click OK to accept them.

    If you manually set the properties, make them the same as those for the first hDividerBox.

  3. Insert an ibiPlotChart onto the canvas and adjust its size to fit in the hDividerBox.
  4. Set the following properties:
    • id=subplot01
    • ibiGroupBy=PRODUCT
    • ibiDisplayName=PRODUCT
    • ibiParent=MAIN01
    • ibiXField=PRODUCT
    • ibiYField=Sum.DOLLARS
    • ibiUseFiltered=true
    • Width=330px
    • Height=228px

Top of page

x
Procedure: How to Create a Bubble Chart

The bubble chart requires three numeric fields. The first two control the position of the bubble; the third controls its size. The COMPUTE command in the WebFOCUS procedure (xmltest) that you created earlier in Creating an Input File in WebFOCUS Developer Studio computes the cost of goods sold (COGS).

  1. Insert an ibiBubbleChart onto the canvas, to the right of the plot chart, and size it accordingly.
  2. Set the following properties:
    • id=subbubble01
    • ibiDisplayName=Product
    • ibiGroupBy=PRODUCT
    • ibiParent=MAIN01
    • ibiRadiusField=Sum.UNITS
    • ibiXField=Sum.DOLLARS
    • ibiYField=Sum.COGS
    • ibiUseFiltered=true
    • Width=330px
    • Height=228px

    Tip: You can nest the two horizontal dividers in a vertical divider component, allowing you to adjust the height of the top and bottom charts. For more information, see the Flex Builder documentation.

  3. Run the application.

    ibiBubbleChart in output


WebFOCUS