Creating an Aggregated Grid Using Existing ibiDataGrid Data

In this section:

How to:

You can create an aggregated grid by using any other ibiDataGrid as the data source. For example, by using the first grid MAIN01 as the data source, you are essentially reusing data already loaded into the application. To do that, you must establish a parent/child relationship between the two grids, in which the parent grid is the source of data for the other grid.


Top of page

x
Procedure: How to Create an Aggregated Grid
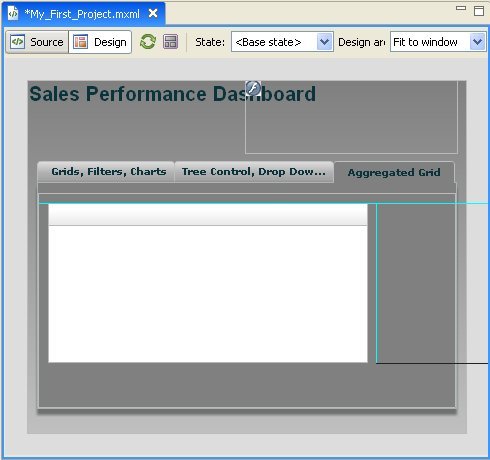
  1. Follow the instructions in Logically Organizing Content With the TabNavigator to add another tab. Name the tab Aggregated Grid.
  2. Insert another ibiDataGrid onto the canvas and set the ID to SUB01.
  3. To make the SUB01 grid a derivative or a child of the first grid MAIN01, specify that the ibiParent is MAIN01. SUB01 can use the data already available in MAIN01.
  4. In the ibiUseColumns property field, specify that only the columns REGION,ST will be displayed. Do not include any spaces between the comma and the field name.
  5. For the tab on which the SUB01 grid is placed, view the MXML code generated for you.

    For SDK 3.x:

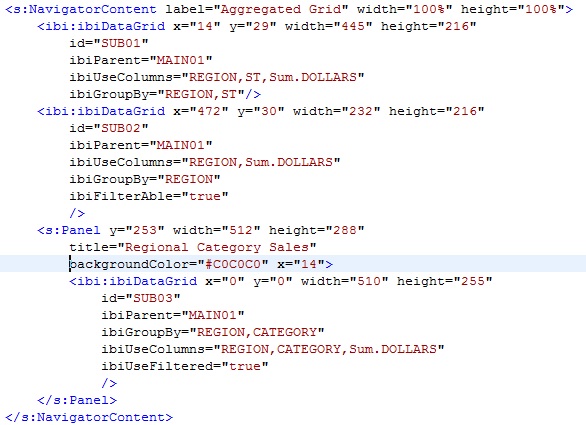
    <mx:Canvas label="Aggregated Grid" width="100%" height="100%">
      <ibi:ibiDataGrid x="25" y="22" width="345" id="SUB01"
         ibiParent="MAIN01" ibiUseColumns="REGION,ST"/>
    </mx:Canvas>

    For SDK 4.x:

  6. Run the application. All the rows for the two fields, REGION and STATE, are displayed in the grid. Notice that the same region is listed multiple times because the grid is not yet aggregated, meaning it contains all transactions for each region.

    Sales Performance Dashboard in web browser

  7. To display only the unique row values, meaning the distinct pairs, use the ibiGroupBy property and provide the grouping columns (ibiGroupBy=REGION,ST). In this case, grouping by both columns produces the distinct values. Notice that NY is listed only once.

    Sales Performance Dashboard in web browser

  8. To create an aggregation, first add the column DOLLARS to ibiUseColumns. Add the aggregation function Sum as a prefix to DOLLARS. Run the application and you will see the sum of DOLLARS by REGION and STATE.

    Sales Performance Dashboard in web browser

  9. To create another roll-up table for regions only, copy SUB01 and paste it to the right of SUB01.
  10. Adjust the width and align the tops of the two tables. As you move the new table, the green guidelines will be displayed when the two table tops are aligned. If you release the mouse, the second table will snap to the guideline.

    Flex Builder canvas Design View

  11. Change the ID of the second grid to SUB02. Flex Builder automatically assigns unique IDs, but it is good practice to follow a logical naming convention. Notice that when you pasted the grid, all original properties were preserved.
  12. Go to ibiGroupBy and remove ST (State).
  13. Go to ibiUseColumns and remove ST.
  14. Run the application. You will see two grids displaying different levels of aggregation.

    Sales Performance Dashboard in web browser


Top of page

x
ibiUseColumns Property

The ibiUseColumns property, available in the ibiDataGrid component, allows you to apply spaces, tabs, and carriage returns to add values over multiple lines.


Top of page

x
ibiUseAggSort Property

A property called ibiUseAggSort is available to improve the performance of the application when the data is sorted and aggregated in IBI components. When this is set to true in the components that use ibiGroupBy field to aggregate data, it uses the custom sort function instead of the sort functionality of Flex to perform data aggregation. The default is set to false.


Top of page

x
Prefix Operators for Data Aggregation

In addition to aggregating column values using the Sum. prefix in the field name, you can use the following prefix operators to perform different calculations directly in the data grid.

Prefix

Operation

Average.

Computes the average value of the field.

Count.

Counts the number of occurrences of the field.

Distinct.

Counts the number of distinct values within the field.

GrandTotal.

Generates the total column values for the field.

Max.

Generates the maximum value of the field.

Min.

Generates the minimum value of the field.

Percent.

Computes the percentage of a field based on the total values for the field.

Sum.

Sums the field values.

The GrandTotal prefix automatically sums and creates a column total of all values in a specific field. To specify having no ibiGroupBy field, use the following syntax:

ibiGroupBy="*"


x
Using the Compute Prefix to Add Custom Calculated Results in the Columns

You can use the Compute. prefix operator to add derived columns into ibiDataGrid based on user defined calculations using the columns available in the data retrieved, in addition to using supported prefix operators to provide basic calculations.

The Compute. prefix can be used with the following syntax.

Compute.define_function_name(field_name1, field_name2,...)

where:

define_function_name

Is the name of the function that defines the calculations.

field_name

Is the name of the field used in the function. The number of fields corresponds to the number of arguments specified in the function that defines the calculations.

Note: You need to define the calculation and reload data into the data grid with the new columns using an ActionScript function in the <mx:Script> section of the application.


Top of page

x
Procedure: How to Reuse Content

Flex provides many capabilities for reusing content. You can copy and paste compound components, for example, a grid that is nested in a panel.

  1. Go to the first tab and select the entire panel containing the MAIN01 grid.
  2. On the main toolbar, select Copy from the Edit menu.
  3. Select the Aggregated Grid tab, and paste the copied panel containing the MAIN01 grid.
  4. Move the grid panel below the other two grids and align it with the left grid.
  5. Change the panel title to:
    Regional Category Sales
  6. Select the grid within the panel.
  7. Change the ID to SUB03.
  8. Remove the value for seturl.
  9. Set ibiParent to MAIN01.
  10. Set ibiGroupBy to REGION,CATEGORY.
  11. Set ibiUseColumns to REGION,CATEGORY,Sum.DOLLARS.
  12. Run the application, which displays the three different aggregated grids.

    Sales Performance Dashboard in web browser


WebFOCUS