The Analysis Designer enables
you to specify parameter options and run a view based on those options.
The available parameter options are grouped into five sections:
Layout, Groupings, Data, Filters, and Report.
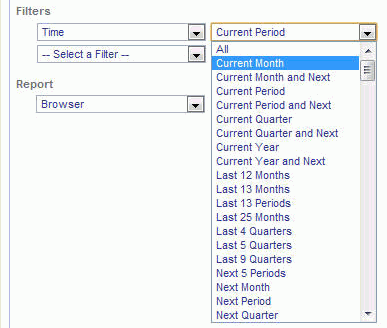
In the Filters section of the Analysis Designer, you can filter
the view by selecting any combination of specific values including
time, product, scorecard, objective, perspective, theme, metrics,
location, organization, and measure. If you want to select multiple measures,
click the browse (...) button to the right of the Measure drop-down
menu. The Multi-Measure Selector dialog box opens.
Note that you can force the report to always use the selected
scorecard by selecting the check box next to Scorecard in the Filters section of the Analysis
Designer. Leaving the check box clear allows an end user to pass
the scorecard they wish to view at run time.
In the Layout, Groupings, and Data sections of the Analysis Designer,
you can select a report template, sort criteria, and the type of
data you want to show. There are nine different report templates
that you can select: Metrics Vertical Sort, Metrics Across Dimension, Metrics
Crosstab, Objectives Vertical Sort, Objectives Across Dimension,
Objectives Crosstab, Themes Vertical Sort, Themes Across Dimension,
and Themes Crosstab. You can select from primary and secondary vertical
sort fields, and a horizontal sort field when you select the Metrics
Across Dimension or Objectives Across Dimension report templates. Views can be sorted by perspective,
objective, year, quarter, month, location, product, organization,
supplier, or theme. You can control the output by selecting to show
actual output data, multiple alternate targets plus indicators,
or the percentage of goals achieved plus indicator information.
For an example of displaying multiple alternate targets in a view,
see Running the
Metrics Vertical Sort View. Additionally, the Analysis Designer
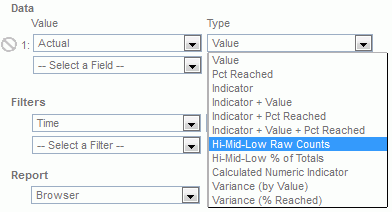
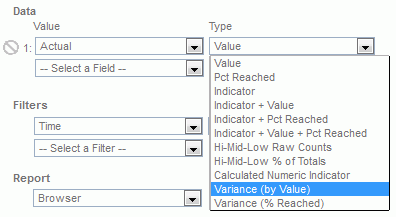
enables you to show any combination of value, percent reached, and indicator
to compare up to four columns of data. This gives you the ability
to create thousands of different views.
In the Report section of the Analysis Designer, you determine
the output format by selecting to display the view in a browser,
a PDF file, a WebFOCUS HTML active report, an Excel spreadsheet, which can be sent to end users for offline analysis. Enter
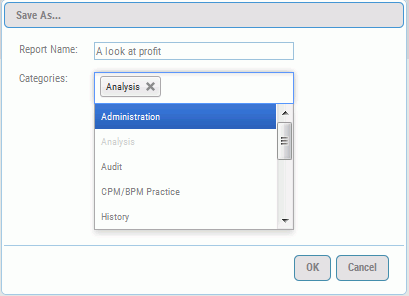
a report
name at the top of the Analysis Designer so it can be saved for
future use. You can also use the Quick Reporting Mart option to take data from PMF and build custom content. For more information,
see Designing a PMF Quick Reporting Mart.
Running the Metrics Across Dimension View
PMF provides the Metrics Across Dimension template,
which you can use to create a view that displays metrics horizontally
across your organization using the selected parameters. This view
requires you to select an Across sort field.
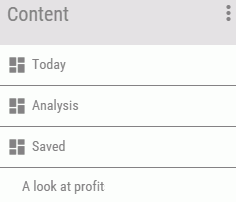
To run the Metrics Across Dimension view, click the dashboard icon  on the Today page. Click Content, select Analysis, and then click Analysis Designer. The Analysis Designer opens where you select
the desired report template and specify your parameter options.
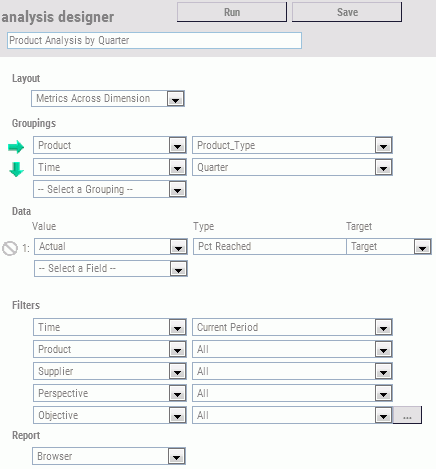
Type a report name in the field provided (for example, Product
Analysis by Quarter). From the Layout drop-down menu, select Metrics
Across Dimension and then select the desired parameters
in the Groupings and Filters sections, as shown in the following
image.
Click Run to execute and open the grid.
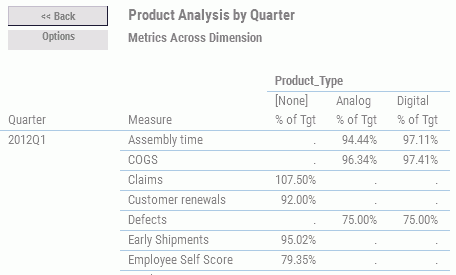
The following image shows the Metrics Across Dimension view for
the selected parameter values.
The Options button at the top-left of the view enables you to
Print the view, Output (export) to an Excel file, Output to a PDF,
add to Mobile favorites, or Schedule the run time and distribution
of the view using the Report Wizard. You can also display alternate
target data in the view by selecting Show Benchmark, Show Forecast,
or Show Stretch Target.
Running the Metrics Vertical Sort View
PMF provides the Metrics Vertical Sort template, which
you can use to create a view that displays metrics vertically using
the selected parameters and vertical sort field.
To run the Metrics Analysis, click the dashboard icon  on the Today page. Click Content, select Analysis, and then click Analysis Designer. The Analysis Designer opens where you select
the desired report template and specify your parameter options.
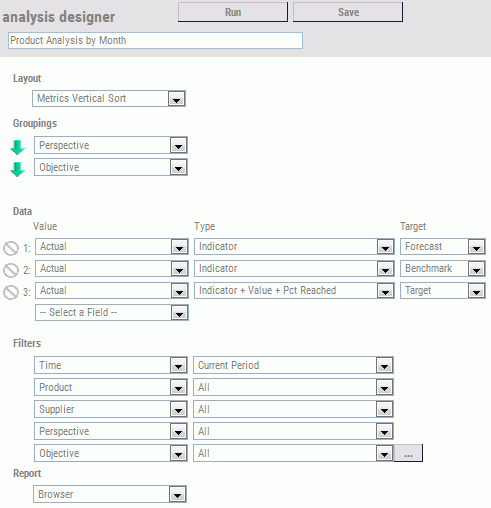
Type a name in the field provided (for example, Product Analysis
by Month). From the Layout drop-down menu, select Metrics
Vertical Sort, and then select the desired parameters
in the Groupings and Filters sections, as shown in the following
image.
Click Run to execute and open this view
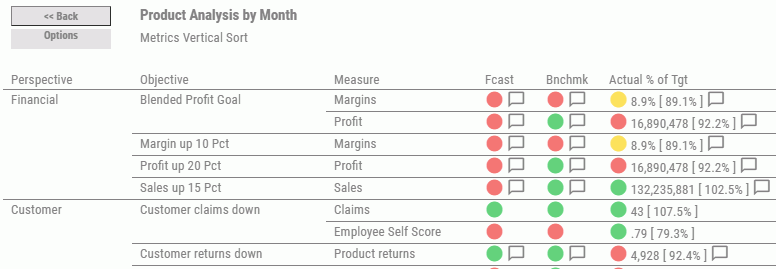
in a new window. The following image shows the Metrics Vertical Sort
view for the selected parameter values.
The Options button at the top-left of the view enables you to
Print the view, Output (export) to an Excel file, Output to a PDF,
add to Mobile favorites, or Schedule the run time and distribution
of the view using the Report Wizard. You can also display alternate
target data in the view by selecting Show Benchmark, Show Forecast,
or Show Stretch Target.
Ranking Metrics and Objectives
Metrics and objectives for views and in gadgets can
be displayed based on the ranking of their performance or value.
The available options are Rank Ascending or Rank
Descending. The default sorting setting is alphabetic.
To set up Ranking, click the dashboard icon  on the Today page. Click Content, select Analysis, and then click Analysis Designer. The Analysis
Designer opens where you select the desired report template and
specify your parameter options. If you click to the left of the
data field, of the Value that you want to rank, a ranking button
appears, as shown in the following image.
If you click to the left of another field and the previous field
has been ranked, it will transfer to the newly selected field.
Note: Only Vertical Sort styles of the Measure, Objective,
and Theme templates can support ranking.
PMF ranking sorts the report information by the value or the
percent reached. For example, if you chose a value for actual or
target, PMF ranks based on the value of the field for the indicators.
If you choose a percent reached field, or a combo indicator, PMF
ranks based on the percent reached for the indicators.
If you choose a sort value from the Sorting options, PMF displays
the rank within the outermost sort type indicated. For example,
if sorting by one or more Dimensions, PMF performs the rank within
the innermost dimension. If sorting by Perspective, PMF ranks the items
within each perspective. The only exception to this is when sorting
on the Time Dimension.
![]() on the Today page. Click Content, select Analysis, and then click Analysis Designer. The Analysis Designer opens where you select
the desired report template and specify your parameter options.
on the Today page. Click Content, select Analysis, and then click Analysis Designer. The Analysis Designer opens where you select
the desired report template and specify your parameter options.
