In this section: How to: |
PMF is a WebFOCUS application that allows your enterprise to track and store metrics, aggregate these metrics into scorecards to clearly evaluate your enterprise goals, and track projects and initiatives across your enterprise. It also provides tools to help you keep the metrics updated with current data. PMF metrics are multi-dimensional, to let you track your progress and see how your work integrates with overall enterprise strategy. PMF is a standard WebFOCUS application that runs on a WebFOCUS Reporting Server. It takes advantage of many of the capabilities of WebFOCUS.
PMF has a full suite of views that allows analysis of your organization metrics, with or without a strategic component. PMF metrics are multi-dimensional, giving you many ways to slice and dice your metrics. PMF also has structured ad hoc tools and full ad hoc capability to let you design information presentation in millions of ways. PMF data is easy to integrate with all financial, process, and operational data in your enterprise.
Note: This procedure describes how to access the default PMF logon window. Depending on your configuration, your logon window or other means of accessing PMF might be different.
http://server_name/
where:
Is the name provided by your administrator.
A Performance Management Framework logon panel opens.
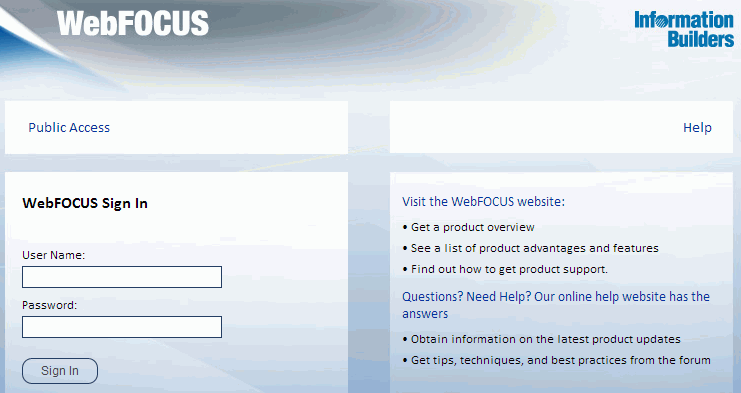
When you first log on, the Today tab is the active tab. For details about the Today tab, see Today Tab. Another tab that is available is the Analytics tab. See Working With the Analytics Tab.
Note: Your login panel might be different, or your logon might be “single sign on”, which means you log on automatically.
How to: |
PMF displays gadgets and stores dashboards for each user. You can use either the Unlock the Dashboard button or the Preferences button in the upper-right corner of the Today tab to change the type of view displayed on your dashboard. You can also set up or modify personal information that applies to your PMF session.
For consumers and analysts, a separate Preferences button exists for each of the gadgets displayed on a dashboard. These gadgets display performance trend data that you can monitor daily. Each gadget has a Preferences button that enables you to change the values being used to display the data for that gadget. Each gadget has the following three icons you can select:
Note: These three icons are removed from view when you click anywhere outside the action block.
The Today Page drop-down menu appears to the left of the cluster of icons, as shown in the following image.
The Unlock the Dashboard icon is replaced by the following five icons:
Note: Clicking the Save preferences or Lock the Dashboard icons replaces them with the unlock dashboard icon and hides the Today Page drop-down menu.
The Edit Today page icon is only available if you have Administrator rights.
The previous view of your dashboard is replaced with the selected view.
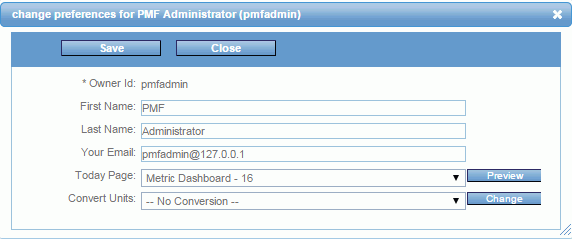
The following image shows the Change Preferences panel that opens, with sample values in the fields.
Field |
Description |
---|---|
Owner Id |
ID of the person currently logged on. You cannot change the value in this field. |
First Name |
First name of the person associated with the Owner Id. |
Last Name |
Last name of the person associated with the Owner Id. |
Your Email |
Email address of the person associated with the Owner Id, used when Alerts are fired. |
Today Page |
Type of dashboard view displayed from the Today tab by default. You can change the view by selecting a different one from a catalog of personalized dashboards using the Today Page drop-down menu. You can click the Preview button to see what this view looks like. You can also change this option quickly by unlocking the Ribbon. See How to Change the Display of Your Dashboard. |
Convert Units |
If an administrator has created multiple conversion profiles, you can select a different profile (than the one assigned to you) using the Convert Units drop-down menu. Selecting a different profile converts and refreshes the metrics displayed in your views. Click the Change button to apply a selected conversion profile. Note: An administrator can also disable conversions. |
Note: You can click Change to save your new preferences for the current session. The previous settings will be restored once the current session is over.
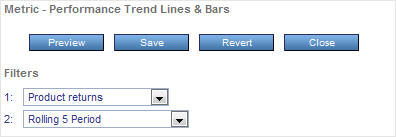
The following image shows the Gadget Preferences panel that opens, with the current selection values in the drop-down menus.
Depending on how the selected gadget was designed, you can change preferences using any of the available drop-down menus, which can include Groupings, Levels, and one or more Filters.
Before you save your changes, you can click Revert to restore the previous settings or Close to exit the Preferences panel.
After saving your changes, the next time you refresh the page, or log out and log back in to PMF, the gadget you modified displays your changed preferences.
You can click the Refresh content icon in the upper-right corner of the graph gadget to view your changes now.
WebFOCUS |