This section provides an overview of the Activity Facility, formerly known as Audit Manager, and describes how to configure it. The iWay Service Manager administrator is responsible for configuring the Activity Facility.
The Activity Facility now featured in the iWay Service Manager Administration Console was formerly a component of iWay Trading Manager. It maintains a record describing each message that passes through the server. The messages are associated and integrated with the transactions. This makes it possible for an auditor to review them individually or in conjunction with other messages that fall within the scope of the same transaction. Filtering options determine whether the Activity Facility records original input messages, each emitted message, transaction termination status, intermediate activities (for example, parsing and transformations), or all of the above. Activity records enable users to research the status of individual transactions. When used in conjunction with the iWay Enterprise Index (iEI) component or Correlation Facility, the Activity Facility enables these components to retrieve appropriate historic information for their purposes
The following types of Activity Facility handlers are available for configuration:
- EDI Activity Logs.
- iAM 102 Transaction Log Emulator.
- iEI Message Manager. Used for WebFOCUS Magnify integration and for Audit Indexing. Not used for direct indexing. For more information, see How to Configure the iEI Message Manager Handler.
- Local BAM Driver.
- SQL-Based Activity Logs Preferred Activity Facility handler. For more information, see How to Configure the SQL-Based Activity Logs Handler.
- Trace logger for test use only. Used for testing purposes. For more information, see How to Configure the Trace Log Handler.
- Time event logger for performance measurements. Used for benchmarking purposes. This handler gathers statistics and produces Microsoft Excel spreadsheets. For more information, see How to Configure the Time Event Logger.
To configure the SQL-Based Activity Logs handler:
-
Configure
a JDBC data provider using the iWay Service Manager Administration
Console.
For more information on configuring data providers, see Data Provider. Once you have finished, you can continue with configuring the SQL-Based Activity Logs handler.
-
In the left
console pane of the Server menu, select Activity Facility.

The Activity Facility pane opens.

The table that is provided lists the configured Activity Facility handlers. Initially, no handlers are shown.
-
Click Add to
configure a new SQL-Based Activity Logs handler.
The configuration pane for the Activity Facility handler opens.

-
Select SQL
Based Activity Logs from the Type drop-down list.
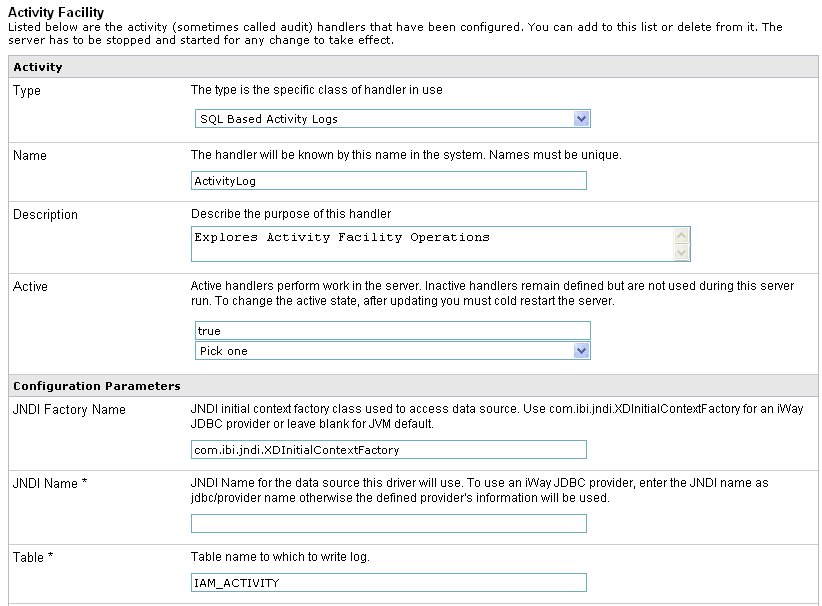
The Activity Facility pane refreshes and displays the parameters for the SQL-Based Activity Logs handler, as shown in the following image.
-
Provide
values for the parameters, as listed and defined in the following table.
Parameter Name
Type
Description
Name (required)
String
Type a unique name for the SQL-Based Activity Logs handler.
Description
String
Text Area
Type a description for the SQL-Based Activity Logs handler (optional).
Active (required)
Boolean
Drop-down list
If set to true, the SQL-Based Activity Logs handler is activated by default upon server startup. Inactive handlers remain defined but are not automatically activated. You must restart the server to ensure the handler is in an active state.
Configuration Parameters
JNDI Factory Name
String
JNDI initial context factory class used to access the data source. Use com.ibi.jndi.XDInitialContextFactory for an iWay JDBC provider or leave blank for JVM default.
JNDI Name (required)
String
JNDI name for the data source that is used by the driver. To use an iWay JDBC provider, enter the JNDI name as jdbc/provider_name otherwise the defined information for the provider will be used.
Table (required)
String
Table name for the activity log. This must be a valid identifier in the database being used. If the table does not exist at startup, it will be created automatically.
Compression
Drop-down list
Specify whether the messages are to be compressed. Values include:
- none (default)
- smallest
- fastest
- standard
- Huffman
Start Events (required)
Boolean
Drop-down list
If set to true (default), the input messages will be recorded in the activity log. This value must be set to true for use of the audit reports in the console.
Internal Events (required)
Boolean
Drop-down list
If set to true, system events are included in the activity log. System events include activities, such as parsing and transformations (optional). False is selected by default.
Security Events (required)
Boolean
Drop-down list
If set to true (default), security events are recorded. This includes digital signature and so on. This does not include console activity.
Business Error Events (required)
Boolean
Drop-down list
If set to true, business errors are recorded, such as rules system violations. False is selected by default.
Emit Events (required)
Boolean
Drop-down list
If set to true (default), output messages from emitter services will be recorded. This is required for use of the audit log reports in the console.
End Events (required)
Boolean
Drop-down list
If set to true (default), the end of message processing will be recorded in the activity log. This is required for use of the audit log reports in the console.
Notes Table (required)
String
Table name for the notes table, which contains log annotations. If the table does not exist at startup, it will be created automatically.
MAC Algorithm
String
Drop-down list
The Message Authentication Code (MAC) algorithm. None (default) indicates a MAC should not be computed.
MAC Provider
String
Drop-down list
The Message Authentication Code (MAC) provider. Not Specified indicates the default provider should be used. The remaining available value is SunJCE.
MAC Secret Key
String
The Message Authentication Code (MAC) secret key to use.
-
Click Update.
You are returned to main Activity Facility pane where the newly configured SQL-Based Activity Logs handler is added to the list, as shown in the following image.

To configure the iEI Message Manager handler:
-
Configure
a JDBC data provider using the iWay Service Manager Administration
Console.
For more information on configuring data providers, see Data Provider. Once you have finished, you can continue with configuring the iEI Message Manager handler.
-
In the left
console pane of the Server menu, select Activity Facility.

The Activity Facility pane opens.
The table that is provided lists the configured Activity Facility handlers. Initially, no handlers are shown.
-
Click Add to
configure a new iEI Message Manager handler.

The configuration pane for the Activity Facility handler opens.
-
Select iEI
Message Manager from the Type drop-down list.

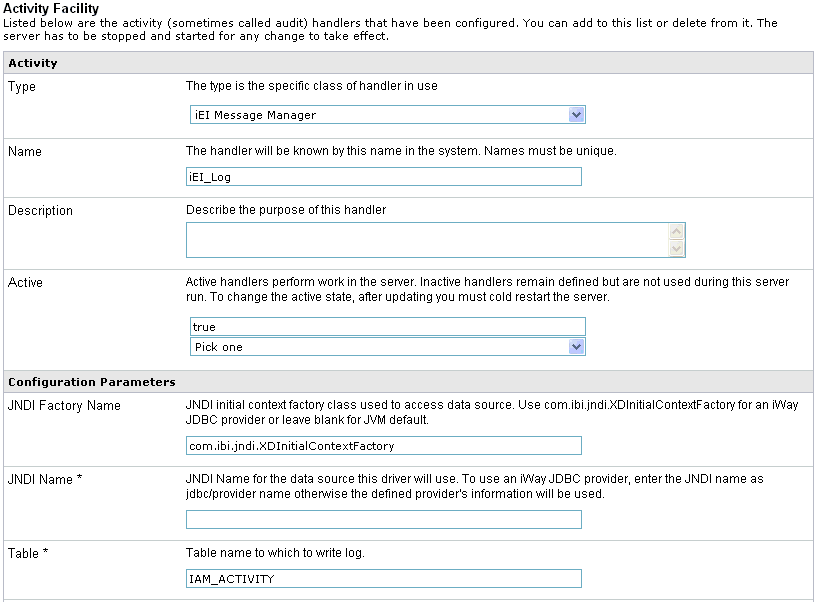
The Activity Facility pane refreshes and displays the parameters for the iEI Message Manager handler, as shown in the following image.
-
Provide
values for the parameters, as listed and defined in the following table.
Parameter Name
Type
Description
Name (required)
String
Type a unique name for the iEI Message Manager handler.
Description
String
Text Area
Type a description for the iEI Message Manager handler (optional).
Active (required)
Boolean
Drop-down list
If set to true, the iEI Message Manager handler is activated by default upon server startup. Inactive handlers remain defined but are not automatically activated. You must restart the server to ensure the handler is in an active state.
Configuration Parameters
JNDI Factory Name
String
JNDI initial context factory class used to access the data source. Use com.ibi.jndi.XDInitialContextFactory for an iWay JDBC provider or leave blank for JVM default.
JNDI Name (required)
String
JNDI name for the data source that is used by the driver. To use an iWay JDBC provider, enter the JNDI name as jdbc/provider_name otherwise the defined information for the provider will be used.
Table (required)
String
Table name for the activity log. This must be a valid identifier in the database being used. If the table does not exist at startup, it will be created automatically.
Compression
Drop-down list
Specify whether the messages are to be compressed. Values include:
- none (default)
- smallest
- fastest
- standard
- Huffman
Start Events (required)
Boolean
Drop-down list
If set to true (default), the input messages will be recorded in the activity log. This value must be set to true for use of the audit reports in the console.
Internal Events (required)
Boolean
Drop-down list
If set to true, system events are included in the activity log. System events include activities, such as parsing and transformations (optional). False is selected by default.
Business Error Events (required)
Boolean
Drop-down list
If set to true, business errors are recorded, such as rules system violations. False is selected by default.
Emit Events (required)
Boolean
Drop-down list
If set to true (default), output messages from emitter services will be recorded. This is required for use of the audit log reports in the console.
End Events (required)
Boolean
Drop-down list
If set to true (default), the end of message processing will be recorded in the activity log. This is required for use of the audit log reports in the console.
Notes Table (required)
String
Table name for the notes table, which contains log annotations. If the table does not exist at startup, it will be created automatically.
iEI
URL for the search appliance (required)
String
URL for the search appliance.
Feed Datasource (required)
String
Data source for search appliance feeds.
Base URL (required)
String
Base URL for indexed feeds. The default base URL is:
http://*:9996/mm
URL Add-on
String
Additional ampersand-delimited key=value pairs to append to the base URL for indexed feeds. SREG() is evaluated
Batch Size (required)
String
Number of records to add to the feed before submitting to search appliance. The default value is 2.
Secure Search? (required)
Boolean
Drop-down list
If set to true (default), HTTP basic authentication is used to secure the feed and queries.
Index Start Events (required)
Boolean
Drop-down list
If set to true (default), start event is indexed.
Index Emit Events (required)
Boolean
Drop-down list
If set to true (default), emit event is indexed.
-
Click Update.
You are returned to main Activity Facility pane where the newly configured iEI Message Manager handler is added to the list, as shown in the following image.

To configure the Trace Log handler:
-
In the left
console pane of the Server menu, select Activity Facility.

The Activity Facility pane opens.
The table that is provided lists the configured Activity Facility handlers. Initially, no handlers are shown.
-
Click Add to
configure a new Trace Log handler.

The configuration pane for the Activity Facility handler opens.
-
Select Trace
logger for test use only from the Type drop-down list.

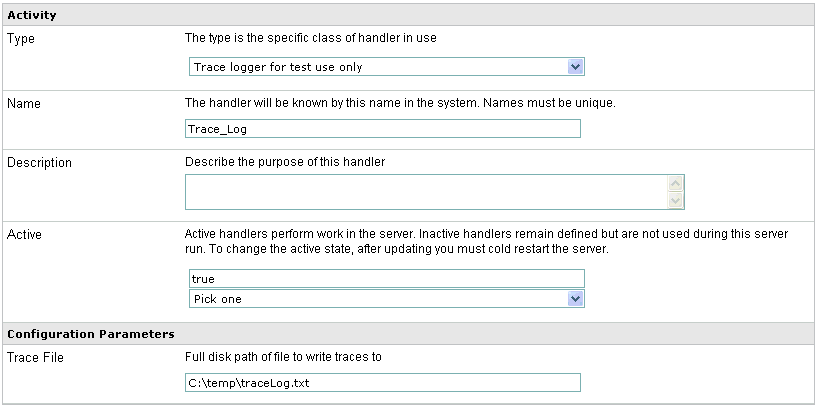
The Activity Facility pane refreshes and displays the parameters for the Trace Log handler, as shown in the following image.
-
Provide
values for the parameters, as listed and defined in the following table.
Parameter Name
Type
Description
Name (required)
String
Type a unique name for the Trace Log handler.
Description
String
Text Area
Type a description for the Trace Log handler (optional).
Active (required)
Boolean
Drop-down list
If set to true, the Trace Log handler is activated by default upon server startup. Inactive handlers remain defined but are not automatically activated. You must restart the server to ensure the handler is in an active state.
Configuration Parameters
Trace File
String
Path to the file where the trace log will be written.
-
Click Update.
You are returned to main Activity Facility pane where the newly configured Trace Log handler is added to the list, as shown in the following image.

A special activity log exit, called the Time Event Logger, is now included among the standard activity log exits. This logger can be used in performance measuring situations, but is not intended itself to be a full performance measuring solution. The Time Event Logger logs statistics for each message and internal event executed in the iWay Service Manager (iSM) server. In iSM, an event is the execution of a component, such as a transform, rule validation, process flow, or service within the flow.
Log exits can also record other events, such as error messages, business errors detected by a process, an emit of a message, and so on. The Time Event Logger does not record this information. Similarly, this exit is unconcerned about the status of the message during its flow. You are expected to have structured the performance test such that useful information can be extracted from the measurements that are recorded.
The Time Event Logger generates an output log file intended for use in a standard spreadsheet application. There is no restriction on how the data is actually analyzed.
To configure the Time Event Logger:
-
In the left
console pane of the Server menu, select Activity Facility.

The Activity Facility pane opens.
The table that is provided lists the configured Activity Facility handlers. Initially, no handlers are shown.
-
Click Add.

The configuration pane for the Activity Facility handler opens.
-
From the
Type drop-down list, select Time event logger for performance
measurements.

The Activity Facility pane refreshes and displays the configuration parameters for the Time Event Logger, as shown in the following image.
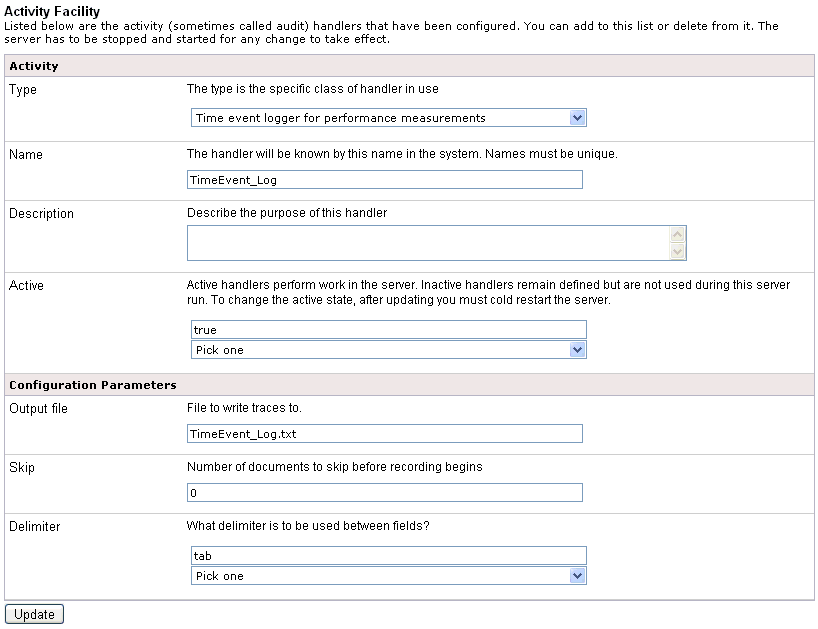
-
Provide
values for the parameters, which are listed and defined in the following
table.
Parameter Name
Type
Description
Name (required)
String
Type a unique name for the Time Event Logger.
Description
String
Text Area
Type a description for the Time Event Logger (optional).
Active (required)
Boolean
Drop-down list
If set to true, the Time Event Logger is activated by default upon server startup. Inactive handlers remain defined but are not automatically activated. You must restart the server to ensure the handler is in an active state.
Configuration Parameters
Output file
String
This is the file where traces are written. As the server starts, a new instance of this file is created. It is the responsibility of the user to save the log file for any server sessions that require further examination.
Skip
String
This is the number of transactions to skip before actual recording starts. When performing runs for relative measures of performance, it is recommended that at least a few transactions not be recorded. This is because the server often performs "lazy initialization" during the first few transactions, so that these are slower than subsequent transactions as routes are established, services are loaded, process flows compiled, and so on.
When testing for measures of more absolute performance, it is important that many transactions be skipped. The Java HotSpot VM uses the first transactions to gather statistics before optimization of the application. In the HotSpot documentation for Java 5.0, Sun recommends 10000 transactions.
Delimiter
Boolean
Drop-down list
Fields in the output file are separated by a delimiter character. You can select either tab or comma. Different spreadsheet and data analysis programs may prefer one or the other. The default delimiter is tab.
-
Click Update.
You are returned to main Activity Facility pane where the newly configured Time Event Logger is added to the list, as shown in the following image.

The Time Event Logger records information pertaining to channel and event execution. As the exit is initialized, a header (often called a DIF header) is written to the output. This represents the column heads for the data to be recorded.
The following table lists and describes the data that is recorded.
|
Recorded Data |
Description |
|---|---|
|
Type |
This is the type of event being recorded (either chan or evnt). A channel record (chan) is the passage of a message from receipt to completion. An event record (evnt) is one activity that takes place during the processing of the message. |
|
Key |
This is a relatively unique key, used to identify the record in the logger. It is used to relate the start of the event to the end of the event, and is not guaranteed to be unique for the duration of the run. It is most likely of little use during data analysis. |
|
Event |
The event identifier. This is an integer used in the iSM server to identify specific events. |
|
Duration |
The wall clock time from the start of the event to its end. |
|
CPU |
The CPU time associated with the event. For this time to be available, the iSM server must be able to record detailed statistics. CPU time is the total amount of time the JVM spends in the thread of execution of the operation. |
|
User |
The user time associated with the event. For this time to be available, the iSM server must be able to record detailed statistics. The user time is the amount of time spent in application (server) code, not including JVM execution time. |
|
Name |
The name of the event. This is used to document the record. |
|
Extra |
Some events may include extra information. For example, an event recording the execution of a service agent will include the name of the agent. |
|
Threaded |
The identifier of the execution thread. |
|
Initiate Time GMT |
The start time of the event, in GMT. |
|
Initiate Time ms |
The Unix Epoch time, extended to milliseconds, at which the event starts. |
An iSM server is capable of recording extended statistics only if the iwmeasure.jar file is installed in the following directory:
<iwayhome>/etc/manager/extensionsNote: The iwmeasure.jar file is only available by request from iWay Software.
The generated data can be loaded into a spreadsheet program for data analysis. A sample is shown in the following image.

Notice that information is recorded upon completion of the event that is being timed. So you can see the channel record (chan) following the events within that channel.
The duration column is recorded in milliseconds, while the cpu and user columns are recorded in microseconds. The actual precision of the recording depends upon the timing characteristics of the processor on which the JVM is running. If the iSM server is not running with the iwmeasure statistics package, cpu and user columns will always be zero. The timings in this example frequently show zeros, however, because the resolution of the clocks shows the difference between the start and end time for the event to be too fast to measure.
The initiate time ms column records the start of event time in Unix Epoch milliseconds. This can be converted to a standard Excel time column by using the following formula:
=(<cell>/86400000)+25569)

This formula accounts for the conversion from the Epoch time to Excel time by determining the number of seconds in the period and adjusting for the difference in the Epoch and Excel starting points (1900 vs. 1970). This example shows how the application of this formula makes the two columns (initiate time GMT and Date format) produce the same values. Naturally, the column can be used for other types of data analysis. This is only an example.


