series: [
   {
      series: number,
      group: number, // optional
      border: {
         width: number,
         color: 'string',
         dash: 'string'
      },
   }
]
where:
- series: number
Is a zero-based series number. If the series does not exist in the chart, the property is ignored.
- group: number
Is an optional zero-based group number. If the group does not exist in the chart, the property is ignored. If a group number is not specified, the border is applied to all risers in the series.
- border
Defines the properties of the riser border.
- width: number
Is a number that defines the width of the border in pixels.
- color: 'string'
Is a color defined by a color name or numeric specification string.
For information about defining colors, see Colors and Gradients.
- dash: 'string'
Is a string that defines the border dash style. Use a string of numbers that defines the width of a dash in pixels followed by the width of the gap between dashes in pixels.
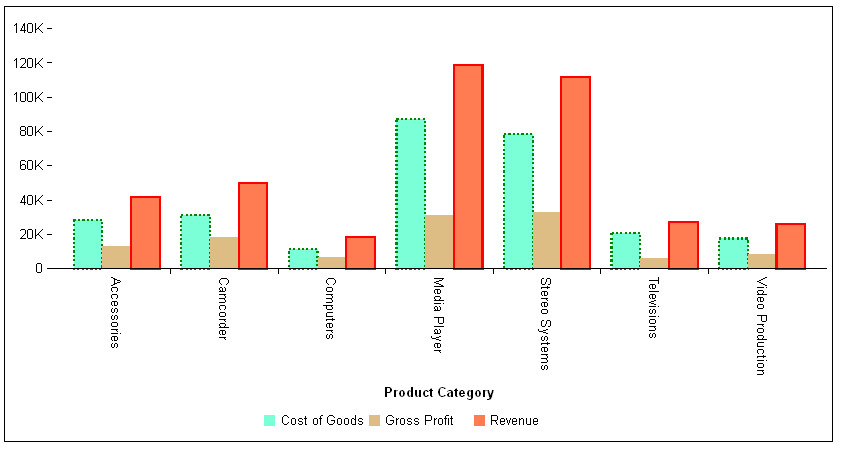
The following request generates a bar chart with three series. The risers for series 0 have a green dashed border, and the risers for series 2 have a red solid border:
GRAPH FILE WFLITE
SUM COGS_US GROSS_PROFIT_US REVENUE_US
ACROSS PRODUCT_CATEGORY
ON GRAPH HOLD FORMAT JSCHART
ON GRAPH SET LOOKGRAPH VBAR
ON GRAPH SET STYLE *
*GRAPH_JS
series: [
   {series: 0, color: 'aquamarine', border: {width: 2, color: 'green',
     dash: '2 2'}},
   {series: 1, color: 'burlywood'},
   {series: 2, color: 'coral', border: {width: 2, color: 'red'}},
]
*END
ENDSTYLE
END
The output is:

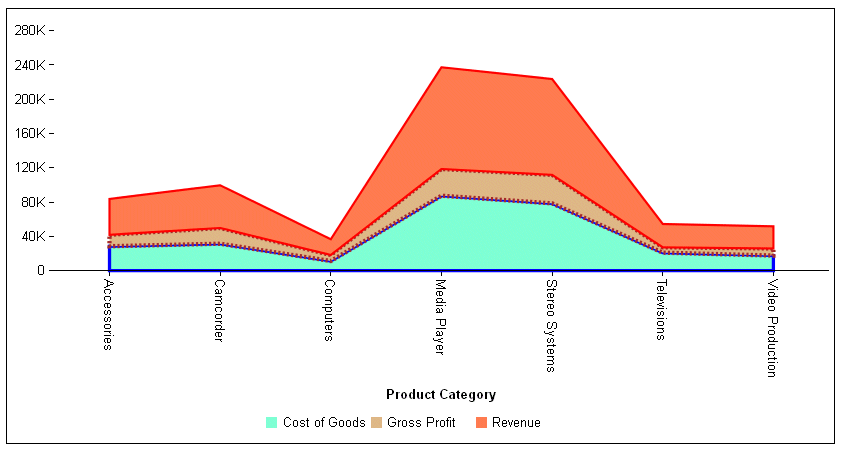
The following request generates a stacked area chart. The riser for series 0 has a blue solid border, the riser for series 1 has a brown dashed border, and the riser for series 2 has a red solid border:
GRAPH FILE WFLITE
SUM COGS_US GROSS_PROFIT_US REVENUE_US
ACROSS PRODUCT_CATEGORY
ON GRAPH HOLD FORMAT JSCHART
ON GRAPH SET LOOKGRAPH VAREASTK
ON GRAPH SET STYLE *
*GRAPH_JS
series: [
   {series: 0, color: 'aquamarine', border: {width: 3, color: 'blue'}},
   {series: 1, color: 'burlywood', border: {width: 4, color: 'brown',
    dash: '2 2'} },
   {series: 2, color: 'coral', border: {width: 2, color: 'red'} },
]
*END
ENDSTYLE
END
The output is:

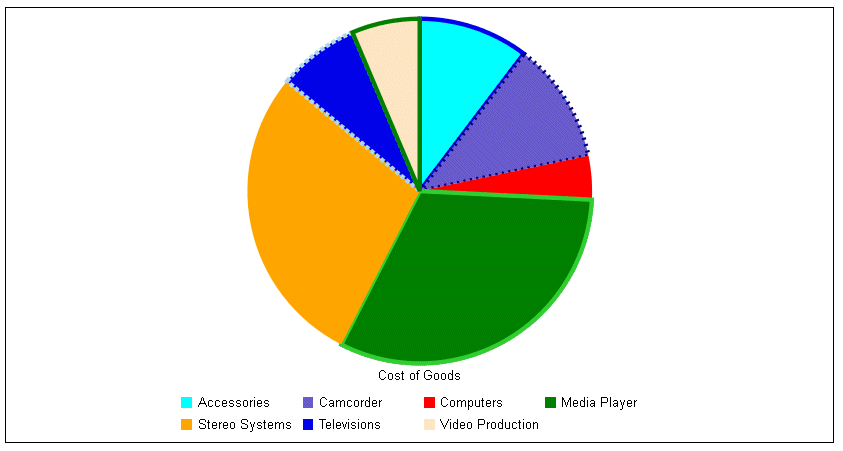
The following request generates a pie chart and defines borders for some of the slices:
GRAPH FILE WFLITE
SUM COGS_US
ACROSS PRODUCT_CATEGORY
ON GRAPH HOLD FORMAT JSCHART
ON GRAPH SET LOOKGRAPH PIE
ON GRAPH SET STYLE *
*GRAPH_JS
series: [
   {series: 0, color: 'cyan', border: {width: 4, color: 'blue'}},
   {series: 1, color: 'slateblue', border: {width: 4, color: 'navy',
    dash: '2 4'}},
   {series: 2, color: 'red'},
   {series: 3, color: 'green', border: {width: 4, color: 'limegreen'}},
   {series: 4, color: 'orange'},
   {series: 5, color: 'blue', border: {width: 4, color: 'lightblue',
    dash: '4 2'}},
   {series: 6, color: 'bisque', border: {width: 4, color: 'green'}}
]
*END
ENDSTYLE
END
The output is:
