In this section: |
Each graph form is defined by a particular combination of verb and sort phrase. The combinations, which were illustrated earlier in GRAPH vs. TABLE Requests, are summarized in the table below (A and B represent two field names).
Point plot:  SUM A ACROSS B (B is numeric)
Histogram:   SET HISTOGRAM=ON
             SUM A ACROSS B (B is alpha)
Bar chart:   SUM A BY B
Pie chart:   SET PIE=ON
             SUM A ACROSS B
Scatter diagram: PRINT A ACROSS B or PRINT A BY B
Each GRAPH request must include a verb and at least one object (up to five are allowed). Three verbs are permitted: COUNT, SUM, and PRINT. SUM is synonymous with either WRITE or ADD. Each verb object must be a computational field (not alphabetic). For example:
GRAPH FILE SALES
SUM SALES
.
.
.
If the verb SUM (or WRITE or ADD) is used, then a bar chart, histogram, line plot or pie chart is produced, depending on the sort phrase and sort field format used. If PRINT is used, the graph is a scatter diagram.
The verb objects, which are the subjects of the graph, may be real or defined fields, with or without direct operation prefixes (AVE., MIN., MAX., etc.). They may also be computed fields. (All of the COMPUTE facilities are available in GRAPH requests.)
When the request has a single verb object, the vertical title of the graph is either the field name of the verb object as it appears in the Master File, or a replacement name supplied in an AS phrase.
When a request contains multiple verb objects, each represents one variable in the graph, and a vertical legend is printed instead of the vertical title. The legend specifies the field names (and/or AS phrase substitutions) and provides a key to which line represents each variable.
In your requests, verb objects may be separated by spaces, or by AND or OVER. OVER has special significance in histogram and bar chart requests, where it controls the stacking of the bars. This is described in the sections on Histograms (see Histograms), and Bar Charts (see Bar Charts).
Verb objects used only for calculations need not appear in your graphs. Use the NOPRINT or SUP-PRINT facilities to suppress the display of such fields.
At least one sort phrase is required in every GRAPH request. This may be either a BY phrase or an ACROSS phrase.
For example:
GRAPH FILE SALES
SUM SALES
ACROSS PROD_CODE
.
.
.
The ACROSS phrase, if there is one, determines the horizontal axis of the graph.
If there is no ACROSS phrase, the last BY phrase determines the vertical axis. When there are multiple BY phrases or when an ACROSS and BY phrase are included in the same request, FOCUS generates multiple graphs; one for each combination of values for the fields referenced in the request (see The Vertical Axis: System Defaults for information regarding control of the vertical axis).
Note: The FOCUS ICU Interface saves data for IBM's Interactive Chart Utility (ICU) in tied data format. If both an ACROSS and BY phrase are present in a GRAPH request, one common axis is established. This enables FOCUS graphs to be displayed as tower charts.
The FOCUS ICU Interface is discussed in further detail in Using the FOCUS ICU Interface. You can also consult the ICU Interface Users Manual for additional information.
The sortfield name may be replaced with an AS phrase. This is useful if the sort phrase specifies one of the axes (it has no effect on any additional sort phrases).
Note that the values of fields mentioned in the additional sort phrases are not displayed automatically in the graph. If you wish to have them appear, you must embed them in a heading or a footing line (see Adding Annotating Text: HEADING and FOOTING Lines).
Selection phrases are used in GRAPH requests to select records of interest. Two phrases are available: IF and WHERE. The examples in this chapter use the IF selection phrase. For a definition of the WHERE clause and the differences between IF and WHERE, see Chapter 5, Selecting Records for Your Report.
The syntax for an IF phrase or a WHERE clause in a GRAPH request is identical to that used in a TABLE request. For example:
GRAPH FILE SALES
SUM SALES
ACROSS PROD_CODE
IF PROD_CODE NE D12
A partial list of the relation tests appears below. See Chapter 5, Selecting Records for Your Report, for a complete list.
Relation | Meaning |
|---|---|
EQ | Equal to |
NE | Not equal to |
GE | Greater than or equal to |
GT | Greater than |
LE | Less than or equal to |
LT | Less than |
CONTAINS | Contains |
OMITS | Omits |
With the FOCUS command MORE, you can graph data from unlike data sources in a single request; all data, regardless of source, appears to come from a single file. You must divide your request into:
- One main request that retrieves the first file and defines the data fields, sorting criteria, and output format for all data.
- Subrequests that define the files and fields to be concatenated to the data of the main request. The fields printed and sorted by the main request must exist in each concatenated file. If they do not, you must create them as DEFINE fields.
During retrieval, FOCUS gathers data from each database in turn. It then sorts all data, and formats the output as described in the main request. The syntax is:
GRAPH FILE file1
main request
MORE
FILE file2
subrequest
 MORE
  .
  .
  .
END
where:
- file1
Is the name of the first file.
- main request
Is a request, without END, that describes the sorting, formatting, aggregation, and COMPUTE field definitions for all data. IF and WHERE phrases in the main request apply only to file1.
- MORE
Begins a subrequest. The number of subrequests is limited only by available memory.
- FILE file2
Defines file2 as the second file for concatenation.
- subrequest
Is a subrequest. Subrequests can only include WHERE and IF phrases.
- END
Ends the request.
See Merging Data Sources, for complete information and for concatenation examples.
To insert annotating text above or below a graph, enter the keywords HEADING and/or FOOTING, followed by the desired contents, including any necessary control elements for skipping lines. The syntax is the same as that used for headings and footings in TABLE requests.
For example:
GRAPH FILE SALES
HEADING
"<7 THIS GRAPH SHOWS SALES BY PRODUCT CODE"
SUM SALES
BY PROD_CODE
IF PROD_CODE NE D12
FOOTING
"<7 FOR ALL PRODUCT CODES EXCEPT D12"
END
Note: When annotating text falls in the path of a plot point on a graph, the plot point is printed; however, connecting points are suppressed if they lie in the path of annotating text. This enables you to adjust the position of the annotating text when you see the contents of the graph. The first line of any heading appears above the first line of the legend.
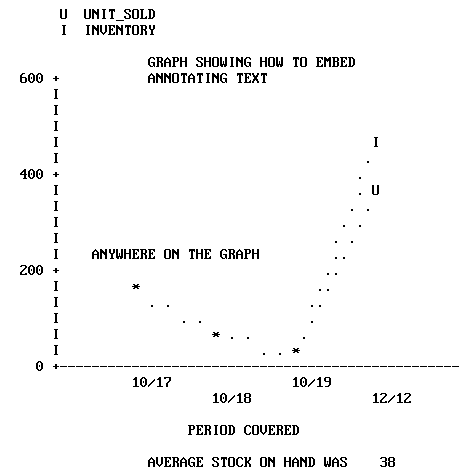
The formatting controls used in TABLE requests can also be used in GRAPH requests for positioning text or field references in heading or footing lines, or in the body of your graph. The following example shows the use of spot markers, which are described in Chapter 9, Customizing Tabular Reports. Run the following request offline to generate the graph shown immediately following the request:
SET HISTOGRAM=OFF
SET AUTOTICK=OFF, VCLASS = 200, VTICK = 25
GRAPH FILE SALES
HEADING
"</4 <22 GRAPH SHOWING HOW TO EMBED"
"<22 ANNOTATING TEXT"
"</10 <15 ANYWHERE ON THE GRAPH"
SUM UNIT_SOLD AND OPENING_AMT AS 'INVENTORY'
ACROSS DATE AS '           PERIOD COVERED'
FOOTING CENTER
"AVERAGE STOCK ON HAND WAS <AVE.OPENING_AMT"
END

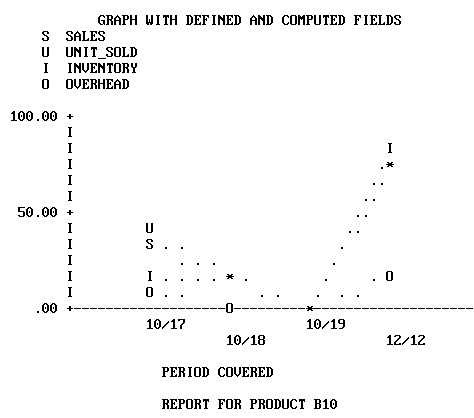
The following example shows how to embed field values in graph heading or footing lines, similar to the capability in TABLE requests. It is useful when annotating graphs created by requests containing multiple sort fields (where only the first named sort field appears as a title on the graph). Run the following as an offline request:
SET HISTOGRAM=OFF
SET AUTOTICK=OFF, VCLASS = 50 , VTICK = 8
DEFINE FILE SALES
SALES/D8.2=RETAIL_PRICE * UNIT_SOLD;
END
GRAPH FILE SALES
HEADING CENTER
"GRAPH WITH DEFINED AND COMPUTED FIELDS"
SUM SALES AND UNIT_SOLD AND OPENING_AMT
AS 'INVENTORY' AND
COMPUTE OVERHEAD/D8.2=.20 * SALES;
ACROSS DATE AS '  PERIOD COVERED'
BY PROD_CODE
IF PROD_CODE IS 'C7' OR 'B10' OR 'B12'
FOOTING CENTER
"REPORT FOR PRODUCT <PROD_CODE"
END
