The following topics explain how to generate each graph
form and adjust the features on the graphs you produce.
The examples in this chapter are drawn on the SALES database
that is included on your system tape. All of the examples assume
that FOCUS default parameters, called SET parameters, are in effect.
The SALES database is used to illustrate
the examples used in this chapter. The Master File and a schematic
diagram of the file appear in Appendix A, Master Files and Diagrams.
An additional temporary field named SALES has been defined, and
is used in many of the examples:
DEFINE FILE SALES
SALES/D8.2=RETAIL_PRICE * UNIT_SOLD;
END
x
GRAPH request syntax is similar
to TABLE request syntax. In fact, the output from many TABLE requests
can be converted directly into a graph by typing the command REPLOT
at the FOCUS command prompt immediately after the output of the request
has been displayed. For example:
DEFINE FILE SALES
SALES/D8.2=RETAIL_PRICE * UNIT_SOLD;
END

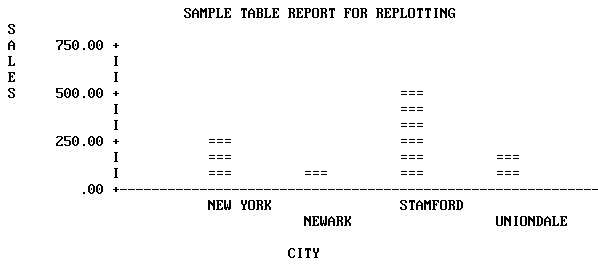
TABLE FILE SALES
HEADING CENTER
"SAMPLE TABLE REPORT FOR REPLOTTING"
SUM SALES ACROSS CITY
END
produces the following:

To convert the output into a graph, exit
the report, and at the FOCUS command prompt, type:
REPLOT
and press Enter.
To produce the graph without creating
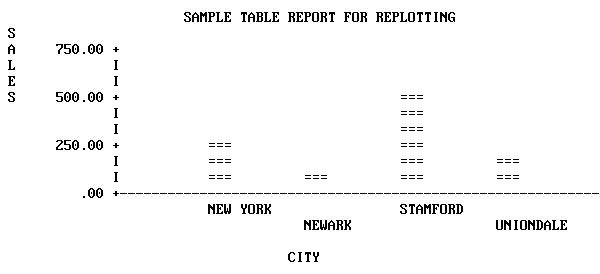
a preliminary tabular report, substitute the command GRAPH for TABLE
in the original request, as shown in the following:
DEFINE FILE SALES
SALES/D8.2=RETAIL_PRICE * UNIT_SOLD;
END

GRAPH FILE SALES
HEADING CENTER
"SAMPLE TABLE REPORT FOR REPLOTTING"
SUM SALES ACROSS CITY
END
Thus, you can produce graphs by converting TABLE requests, but
every TABLE facility does not have a GRAPH counterpart, and there
are some practical limitations on the amount of information that
you can effectively display in a graph. Command Syntax describes
the use of TABLE features in GRAPH requests.
The type of graph (graph form) produced
by a GRAPH request depends on the verb used (such as SUM or PRINT),
the sort phrase used (ACROSS or BY), and the data type of the sort field.
Consider the five graphs that appear on the following pages, and
the requests that produce them.
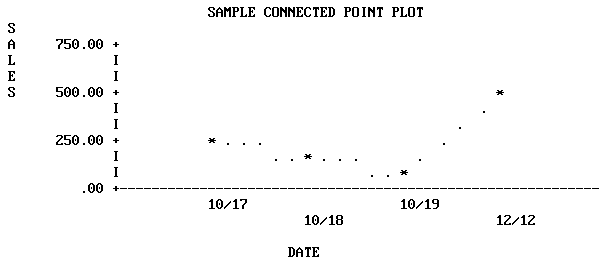
SET HISTOGRAM=OFF
DEFINE FILE SALES
SALES/D8.2=RETAIL_PRICE * UNIT_SOLD;
END

GRAPH FILE SALES
HEADING CENTER
"SAMPLE CONNECTED POINT PLOT"
SUM SALES ACROSS DATE
END
Note: SET parameters remain in effect until you reset
them or log off (see SET Parameters).
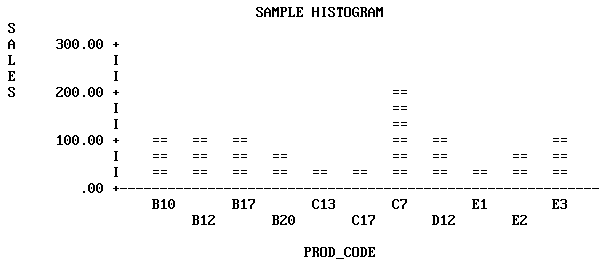
SET HISTOGRAM=ON
DEFINE FILE SALES
SALES/D8.2=RETAIL_PRICE * UNIT_SOLD;
END

GRAPH FILE SALES
HEADING CENTER
"SAMPLE HISTOGRAM"
SUM SALES ACROSS PROD_CODE
END
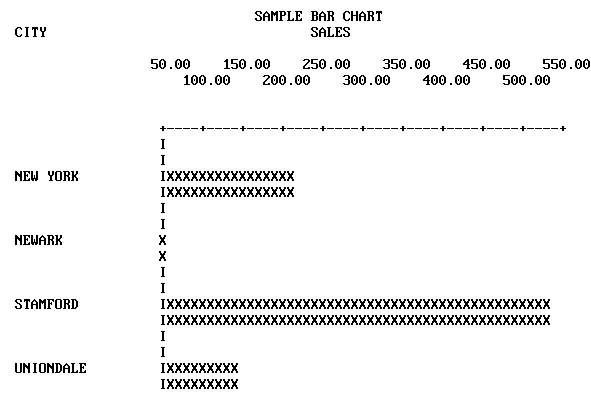
SET BARWIDTH=2, BARSPACE=2
DEFINE FILE SALES
SALES/D8.2=RETAIL_PRICE * UNIT_SOLD;
END

GRAPH FILE SALES
HEADING CENTER
"SAMPLE BAR CHART"
SUM SALES BY CITY
END
DEFINE FILE SALES
SALES/D8.2=RETAIL_PRICE * UNIT_SOLD;
END

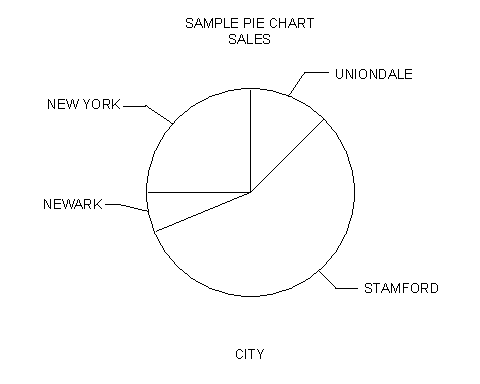
SET PIE=ON, GCOLOR=OFF
SET VAXIS=50, HAXIS=100

GRAPH FILE SALES
HEADING CENTER
"SAMPLE PIE CHART"
SUM SALES ACROSS CITY
END
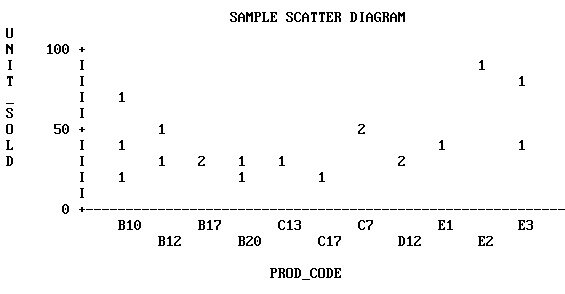
SET HISTOGRAM=OFF

GRAPH FILE SALES
HEADING CENTER
"SAMPLE SCATTER DIAGRAM"
PRINT UNIT_SOLD ACROSS PROD_CODE
END
xRunning Graph Requests Offline
Certain options in a graph request may prevent the graph
from displaying properly on the screen. In this case, you can run
the graph request offline, and spool the output to a sequential
file.
x
Procedure: How to Run a Graph Request Offline
-
Create a sequential file to contain the graph output and allocate
it to DDNAME OFFLINE. For example:
DYNAM ALLOC DD OFFLINE DA USER1.OFFLINE.DATA SHR REU
Note
that the LRECL for the sequential file should be 132.
-
Issue the following command to route graph output to this file:
OFFLINE
If
you want to run a request online after issuing the OFFLINE command,
issue the ONLINE command:
ONLINE
You
can then issue the OFFLINE command to run a request offline.
Each
new graph request that is run offline appends its output to this
file until you issue the following command:
OFFLINE CLOSE
x
In each of the previous graphs, FOCUS created a clear
representation of the data using default values for the graph features
(such as axis lengths, axis scales, or titles). You can issue your
initial request and concentrate on selecting the data, while FOCUS
controls all of the features on the graph.
When satisfied with the data portrayed in your graph, you can
refine its appearance by adjusting the parameters that control the
look of the graph. You can set the control parameters individually
(for example, SET GRID=ON), or ask FOCUS to prompt you for all of their
values when you execute the SET GPROMPT=ON command.
Note: When entering several SET parameters on one line,
separate them with commas.
The request below illustrates some of
the parameters you can control when running the graph offline:
SET HISTOGRAM=OFF
SET HAXIS=75, VAXIS=32, GRID=ON
SET AUTOTICK=OFF, VCLASS=100, VTICK=20
DEFINE FILE SALES
SALES/D8.2=RETAIL_PRICE * UNIT_SOLD;
END

GRAPH FILE SALES
HEADING
"</1 <20 ILLUSTRATION OF"
"<23 GRAPH FEATURES AND CONTROLS"
SUM SALES AND UNIT_SOLD ACROSS PROD_CODE
FOOTING CENTER
"</1 <MIN.RETAIL = CHEAPEST ITEM"
END
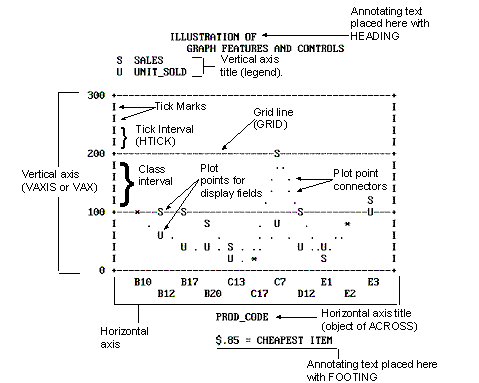
The graph generated OFFLINE in response
to the request appears below.
Note:
- This graph
is a connected point plot, with the plot points representing the sales
(retail_price * unit_sold) and total units sold for each of the
product codes listed across the horizontal axis.
- Annotating
text has been added above and below the graph with the HEADING and FOOTING
facilities. Note the use of spot markers to position text on the
graph, and the embedded calculation with a direct operator.
- Only the vertical
axis is scaled because the ACROSS phrase objects were not numeric
values. The plus symbols (+) mark the class intervals on the axis
scale, and vertical bars mark the tick intervals.
- Horizontal
grid lines appear at the vertical class marks.
For graphs generated ONLINE, FOCUS automatically detects the
height and width of a particular terminal and plots the graph accordingly.
As a result, VAXIS and HAXIS settings are ignored.
You control the graphic elements shown in the previous figure,
Illustration of Graph Features and Controls, in one of two ways:
either by the syntax in the actual request, or with SET commands. Command Syntax describes
the elements in GRAPH requests and their effects. Adjusting Graph Elements describes the adjustable parameters that control
graph features.
There are some additional SET parameters that control non-graphic
elements:
- Specifying
an output device.
- Pausing between
data retrieval and printing to permit the user to adjust paper in the
printer or plotter.
- Using special
black/white shading patterns to simulate different colors.
- Displaying
the current settings of the GRAPH parameters on the screen.
After retrieving data from a file and displaying it either as
a tabular report or a graph, you can use the SET command to adjust
the format and then redisplay the graph by issuing the REPLOT command
(without resorting to further data retrieval).
A summary of all of the SET parameters appears in SET Parameters.
xGraphic Devices Supported
You may create graphs on any terminal or printer that
can print FOCUS reports. If your terminal has no graphics capabilities,
FOCUS uses the characters in the standard character set when producing
graphs. As the default, FOCUS sends GRAPH output to the terminal
(or system printer, if PRINT=OFFLINE). This produces low-resolution
graphics. The examples in the chapter thus far (except the pie chart)
illustrate the default. You cannot create continuous line plots
or pie charts unless you have a high-resolution graphic device.
While FOCUS can accommodate devices with no inherent graphics
capabilities, it can also take advantage of whatever graphics facilities
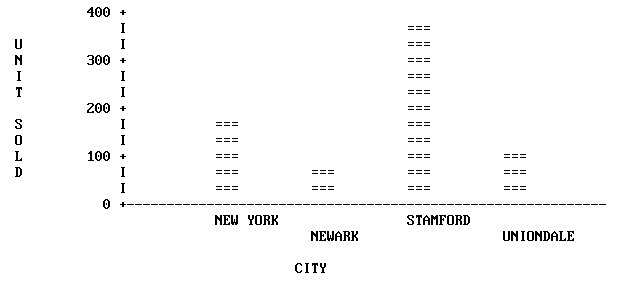
are available. Some personal computers offer ranges of special characters
that can be used to create more readable graphs. The following figure
shows a graph on an IBM PC mono screen:
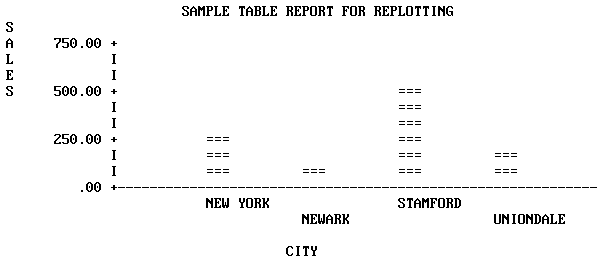
If color monitors or multiple-pen plotters are available, graph
quality can be improved. The following figure shows a sample graph
on a plotter. For more information, see Special Graphics Devices.
On IBM mainframes, FOCUS supports the use of high-resolution
terminals such as the Model 3279 via the IBM Graphical Data Display
Manager (GDDM), which is discussed in IBM Devices Using GDDM. Other high-resolution terminals, printers, and plotters
are also supported, and they are listed in this section. To select
one, simply enter the appropriate form of the SET DEVICE command
(see High-Resolution Devices).
Note, in reviewing the device selections, that all have fixed graphic
window dimensions (horizontal and vertical axes), which are fixed
until a new device is selected.
Please note that this list includes only fully tested devices,
although other devices may also work with FOCUS.
x
Medium-Resolution Devices
Anderson Jacobson Models:AJ830, and AJ832 (12 Pitch).
Diablo Models: 1620, and 1620 (12 Pitch).
Gencom Models: GENCOM, and GENCOM (12 Pitch).
Trendata Models: Trendata 4000A, and 4000A (12 Pitch).
x
IBM Graphic Devices (GDDM is required).
- Any IBM
3270 series device that supports GDDM graphics, such as 3279-S3G,
3179, or 3472. This includes PCs with fully compatible 3270 series
hardware and software.
Hewlett-Packard Plotters:
- Four-pen
plotters without paper advance: Models 7220A, 7221, and 7470A (requires
Y cable #17455).
- Four-pen plotters
with paper advance: Models 7220S and 7221S.
- Eight-pen
plotters without paper advance: Models 7220C, 7221C, 7475A (requires Y
cable #17455).
- Eight-pen
plotters with paper advance: Models 7220T, 7221T.
Tektronix Graphic Devices (only monochrome display).
- Models
4010, 4012, 4013, 4014, 4014E, 4015, 4015E, 4025, 4027, 4050 series,
4662, and 4100 series.


