The basic concept behind StyleSheets is that a report
consists of several components, each of which has a specific name.
A StyleSheet file consists of style declarations for those components
whose styles you want to change, along with the formatting that
you want to apply to those components. Any component that you do
not specifically format in your StyleSheet either retains the default
style or inherits a style from a higher level component. Inheritance
is discussed in FOCUS StyleSheet Attribute Inheritance.
In a StyleSheet, you identify a report component with the TYPE
attribute. The following chart lists all report components:
Within certain components, you can select specific subcomponents.
For example, within a heading, you can isolate a particular line
or a particular field. You identify subcomponents with selection
attributes (also called qualifiers). For example, to choose the third
column for the entire report, use the parameters:
xIdentifying an Entire Report, Column, or Row
You can apply formatting to an:
The following illustrates where the REPORT component and the
COLUMN and ACROSSCOLUMN attributes appear in a report, and which
TYPE values you use to identify them. Although in this example the
value for COLUMN is B1 and the value for ACROSSCOLUMN is N2, these
are not the only values you can use to identify these components.
TABLE FILE CENTORD
SUM LINEPRICE LINE_COGS AS 'Line Cost of,Goods Sold'
BY PLANT AS 'Plant'
ACROSS YEAR
WHERE YEAR EQ 2000 OR 2001
HEADING
"Cost Analysis"
FOOTING CENTER
"**End of Report**"
ON TABLE SET PAGE-NUM OFF
END
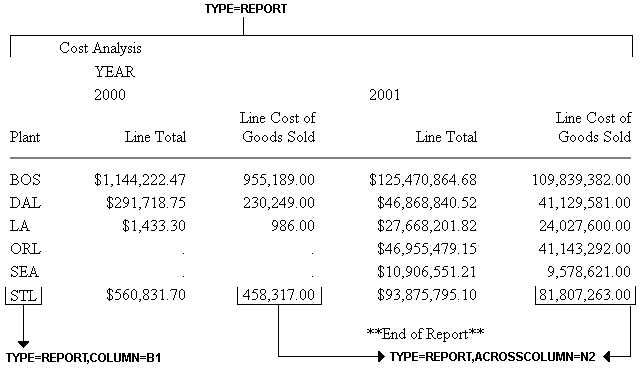
Note: Since this request simply illustrates where the
components appear in a report, it omits a StyleSheet.
x
Syntax: How to Identify the Entire Report
To select
the entire report, use the syntax:
TYPE = REPORT
x
Syntax: How to Identify an Entire Column
TYPE=REPORT, coltype=column
where:
- coltype
Specifies the type of column. It can be:
COLUMN specifies
a sort column (generated by BY), a display column (generated by
PRINT, LIST, SUM, or COUNT), a computed column (generated by COMPUTE),
or a column of row totals (generated by ROW-TOTAL).
ACROSSCOLUMN specifies
every instance of a column that is repeated across a horizontal
sort (ACROSS) row.
- column
Specifies one or more columns. If you are identifying an
ACROSSCOLUMN, the only valid identifiers are Nn and Pn.
Options
for identifying columns in a StyleSheet are:
Identifier | Description |
|---|
Nn | Identifies a column by its position in the
report. To determine this value, count vertical sort (BY) fields,
display fields, and ROW-TOTAL fields, from left to right, including
NOPRINT fields. For an example, see How to Identify a Column of Data. |
Pn | Identifies a column by its position in the
report. To determine the value of n, count vertical sort
(BY) fields, display fields, and ROW-TOTAL fields from left to right.
Do not count NOPRINT fields. |
Cn | Identifies a display column by its position
in the report. To determine the value of n, count only display
fields from left to right, including NOPRINT fields. Do not count
vertical sort (BY) fields or ROW-TOTAL fields. To select all
display fields use C*. |
Bn | Identifies a vertical sort (BY) column by
its position in the report. To determine the value of n,
count only vertical sort (BY) fields, including NOPRINTs, from left
to right. To select all BY fields use B*. |
field | Identifies a column by its field name. When
a field occurs more than once, use field(n) to select a particular
occurrence or field(*) to select all occurrences of the field. |
ROWTOTAL | Identifies a column of row totals generated
using ROW-TOTAL. When used with ACROSS and multiple display commands,
ROWTOTAL generates multiple total columns. Use ROWTOTAL(n)
to select a particular total column. Use ROWTOTAL(field)
to select the row total column for a particular field. Use
ROWTOTAL(*) to select all row total columns in the report. |
Note: Within a StyleSheet, all columns
must be specified in the same way, either by field name or positional
reference.
Example: Identifying an Entire Column
The
following illustrates how to identify an entire column, which consists
of the column data and the column title, in a report. The relevant
StyleSheet declaration is highlighted in the request.
Note: To produce
the same results you can, alternatively, use the values P1, B1,
or the field name (PRODNAME) for the COLUMN attribute in the StyleSheet declaration.
TABLE FILE CENTINV
HEADING
"Excess Stock Report"
SUM QTY_IN_STOCK
BY PRODNAME
WHERE QTY_IN_STOCK GT 10000
FOOTING CENTER
"**End of Report**"
ON TABLE SET PAGE-NUM OFF
ON TABLE HOLD FORMAT HTML
ON TABLE SET STYLE *
TYPE=REPORT, GRID=OFF,$
TYPE=REPORT, COLUMN=N1, STYLE=ITALIC,$
ENDSTYLE
END
The output is:

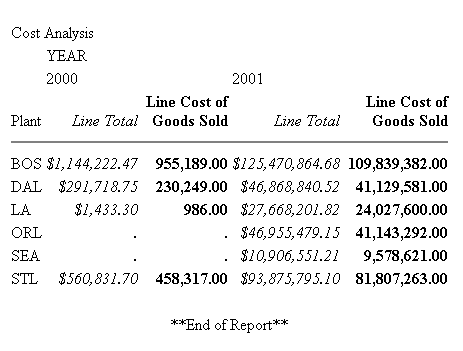
Example: Identifying an Entire Horizontal (ACROSS) Column
The
following illustrates how to identify a horizontal (ACROSS) column.
When you identify and format an ACROSSCOLUMN, all data values and
the column title sort. The relevant StyleSheet declarations are
highlighted in the request.
Note: To produce
the same results you can alternatively use the values P1 and P2,
respectively, for the ACROSSCOLUMN attribute.
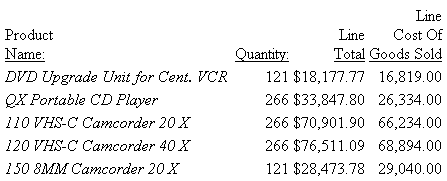
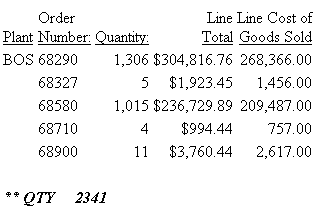
TABLE FILE CENTORD
SUM LINEPRICE LINE_COGS AS 'Line Cost of,Goods Sold'
BY PLANT AS 'Plant'
ACROSS YEAR
WHERE YEAR EQ 2000 OR 2001
HEADING
"Cost Analysis"
FOOTING CENTER
"**End of Report**"
ON TABLE SET PAGE-NUM OFF
ON TABLE HOLD FORMAT HTML
ON TABLE SET STYLE *
TYPE=REPORT, GRID=OFF,$
TYPE=REPORT, ACROSSCOLUMN=N1, STYLE=ITALIC,$
TYPE=REPORT, ACROSSCOLUMN=N2, STYLE=BOLD,$
ENDSTYLE
END
The output is:
x
Syntax: How to Identify an Entire Financial Modeling Language (FML) Row
TYPE=REPORT, LABEL=label
where:
- Rn
Is an implicit row label. To determine the value of n,
count the number of rows up to and including the desired row.
- label
Is an explicit row label.
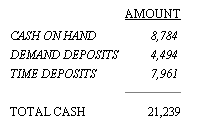
Example: Identifying an Entire FML Row
The
following illustrates how to identify an entire FML row, consisting
of the row label and the row data. The relevant StyleSheet declarations
are highlighted in the request.
TABLE FILE LEDGER
SUM AMOUNT FOR ACCOUNT
1010 AS 'CASH ON HAND' LABEL COH OVER
1020 AS 'DEMAND DEPOSITS' LABEL DD OVER
1030 AS 'TIME DEPOSITS' LABEL TD OVER
BAR OVER
RECAP TOTCASH = R1 + R2 + R3; AS 'TOTAL CASH'
ON TABLE SET PAGE-NUM OFF
ON TABLE HOLD FORMAT HTML
ON TABLE SET STYLE *
TYPE=REPORT, GRID=OFF, $
TYPE=REPORT, LABEL=COH, STYLE=ITALIC, $
TYPE=REPORT, LABEL=DD, STYLE=ITALIC, $
TYPE=REPORT, LABEL=TD, STYLE=ITALIC, $
ENDSTYLE
END
The output is:
x
Syntax: How to Identify an Entire Total or Subtotal Row
TYPE=type, [BY=sortcolumn]
where:
- type
Identifies a subtotal or total. Select from:
GRANDTOTAL which
is a grand total (generated by COLUMN-TOTAL, SUBTOTAL, SUB-TOTAL,
RECOMPUTE, or SUMMARIZE).
SUBTOTAL which
is a subtotal (generated by SUBTOTAL, SUB-TOTAL, RECOMPUTE, or SUMMARIZE).
RECAP which
is a subtotal calculation (generated by ON sortfield RECAP
or ON sortfield COMPUTE).
- BY
When there are several subtotal commands, each associated
with a different vertical sort (BY) column, this enables you to
identify which of the subtotal commands you wish to format.
- sortcolumn
Specifies the vertical sort (BY) column associated with one
of a report's several subtotal commands. Use the field name to identify
the sort column.
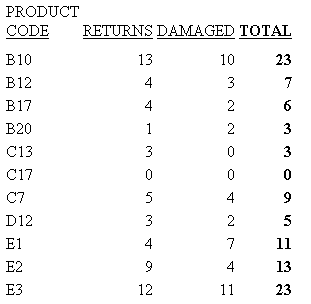
Example: Identifying an Entire Total Row
The
following illustrates how to identify an entire COLUMN-TOTAL row
in a StyleSheet. The relevant StyleSheet declaration is highlighted
in the request.
TABLE FILE SALES
SUM RETURNS DAMAGED AND ROW-TOTAL AND COLUMN-TOTAL
BY PROD_CODE
ON TABLE SET PAGE-NUM OFF
ON TABLE HOLD FORMAT HTML
ON TABLE SET STYLE *
TYPE=REPORT, GRID=OFF, $
TYPE=GRANDTOTAL, STYLE=BOLD, SIZE=12, $
ENDSTYLE
END
The output is:
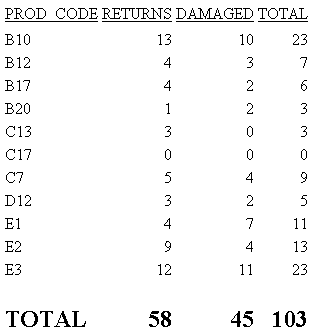
Example: Identifying a Row Total
The
following illustrates how to identify a row total. The relevant
StyleSheet declaration is highlighted in the request. Note that
if you want to format an instance of row-total, you can add a WHEN
statement to your StyleSheet. For details, see Conditionally Formatting in a StyleSheet.
TABLE FILE SALES
SUM RETURNS DAMAGED AND ROW-TOTAL
BY PROD_CODE AS 'PRODUCT,CODE'
ON TABLE SET PAGE-NUM OFF
ON TABLE HOLD FORMAT PS
ON TABLE SET STYLE *
TYPE=REPORT, GRID=OFF, $
TYPE=REPORT, COLUMN=ROWTOTAL, STYLE=BOLD, $
ENDSTYLE
END
The output is:
x
You can identify and format many categories of data
in a report, including:
The following illustrates where the DATA and ACROSSVALUE components
appear in a report, and which TYPE values you use to identify them.
TABLE FILE CENTORD
HEADING CENTER
"UNITS SOLD IN 2002 BY PLANT"
SUM QUANTITY AND ROW-TOTAL AS '2002 TOTAL'
ACROSS QUARTER
BY PLANTLNG AS 'PLANT'
WHERE YEAR EQ 2002
ON TABLE COLUMN-TOTAL AS 'TOTAL UNITS'
ON TABLE SET PAGE-NUM OFF
END
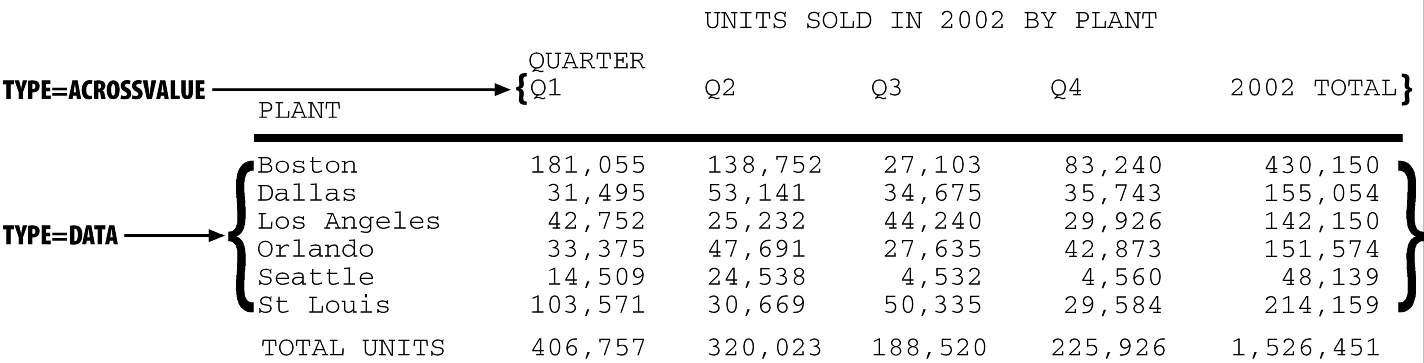
Note: Since this request simply illustrates where the
components appear in a report, it omits a StyleSheet.
x
Syntax: How to Identify All Data
To identify
all report data in a StyleSheet, except for column totals, grand
totals, subtotals, and horizontal sort (ACROSS) values, which need
to be identified separately, use this attribute and value:
TYPE = DATA
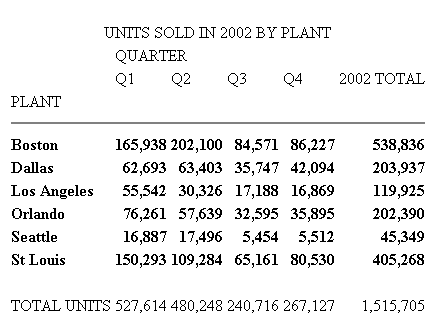
Example: Identifying All Data in a Report
The
following illustrates how to identify all of the data in a report.
The relevant StyleSheet declaration is highlighted in the request.
TABLE FILE CENTORD
HEADING CENTER
"UNITS SOLD IN 2002 BY PLANT"
SUM QUANTITY AND ROW-TOTAL AS '2002 TOTAL'
ACROSS QUARTER
BY PLANTLNG AS 'PLANT'
WHERE YEAR EQ 2002
ON TABLE COLUMN-TOTAL AS 'TOTAL UNITS'
ON TABLE SET PAGE-NUM OFF
ON TABLE HOLD FORMAT HTML
ON TABLE SET STYLE *
TYPE=REPORT, GRID=OFF, $
TYPE=DATA, STYLE=BOLD, $
ENDSTYLE
END
In the output, the titles and grand total are
not bolded because they are not data values:
x
Syntax: How to Identify a Column of Data
TYPE=DATA, COLUMN=column
where:
- column
Specifies one or more columns that you wish to format. For
a list of values, see How to Identify an Entire Column.
Example: Identifying a Column of Data
The
following illustrates how to identify a column of data. The relevant
StyleSheet declaration is highlighted in the request.
Note
that when identifying a column using Nn, NOPRINT columns
are counted. Even though the Product Name field is the first column
in this report, it is identified with N2 because of the NOPRINT
column.
TABLE FILE CENTORD
PRINT QUANTITY LINEPRICE LINE_COGS
BY ORDER_NUM NOPRINT
BY PRODNAME
WHERE ORDER_NUM EQ '48045'
ON TABLE SET PAGE-NUM OFF
ON TABLE HOLD FORMAT HTML
ON TABLE SET STYLE *
TYPE=REPORT, GRID=OFF,$
TYPE=DATA, COLUMN=N2, STYLE=ITALIC,$
ENDSTYLE
END
The output is:
x
Syntax: How to Identify a Row of Horizontal Sort (ACROSS) Data
TYPE=ACROSSVALUE, [ACROSS={fieldname|Nn}]where:
- ACROSS
If you have a request with multiple ACROSS fields, you can
identify each field using the ACROSS identifier. You only need to
include the ACROSS identifier if you have multiple ACROSS fields
in your request.
- fieldname
Specifies a horizontal sort row by its field name.
- Nn
Specifies a horizontal sort row by its position in the sequence
of horizontal sort rows.
Example: Identifying a Row of Horizontal Sort (ACROSS) Data
The
following illustrates how to identify a row of horizontal data values.
The relevant StyleSheet declaration is highlighted in the request.
TABLE FILE CENTORD
HEADING
"Units Sold"
SUM QUANTITY
BY PRODNAME
ACROSS PLANT AS 'Manufacturing Plant'
WHERE PRODTYPE EQ 'Digital'
ON TABLE SET PAGE-NUM OFF
ON TABLE HOLD FORMAT HTML
ON TABLE SET STYLE *
TYPE=REPORT, GRID=OFF, $
TYPE=HEADING, SIZE=12, $
TYPE=ACROSSVALUE, ACROSS=PLANT, STYLE=BOLD, $
ENDSTYLE
END
The output is:
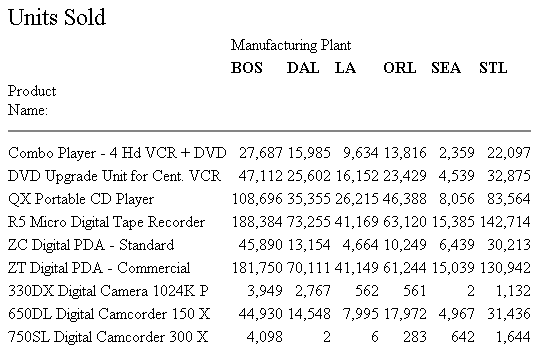
Note: To
produce the same results you can alternatively use the value N1
for the ACROSS attribute in the StyleSheet declaration. For example,
TYPE=ACROSSVALUE, ACROSS=N1, STYLE=BOLD, $.
xIdentifying Totals and Subtotals
Within a StyleSheet, you can identify a report's grand
totals, subtotals, subtotal calculations (generated by ON sortfield RECAP
or ON sortfield COMPUTE), column totals, and row totals in
order to format them. For details on identifying row totals, see Identifying an Entire Report, Column, or Row.
The following example illustrates where these components are
in a report, and which TYPE values you use to identify them.
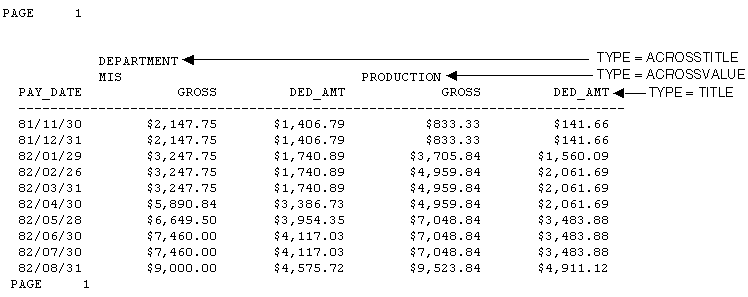
TABLE FILE EMPLOYEE
SUM DED_AMT AND GROSS
BY DEPARTMENT BY PAY_DATE
ON DEPARTMENT RECAP DEPT_NET/D8.2M = GROSS-DED_AMT;
WHEN PAY_DATE GT 820101
ON DEPARTMENT SUBTOTAL
END
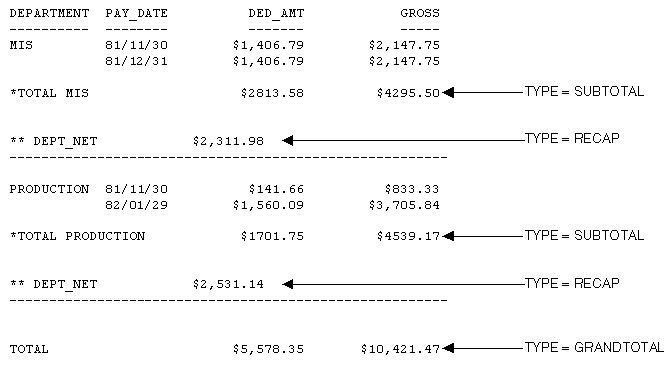
Note: Since this request simply illustrates how to identify
different types of totals and subtotals, it omits a StyleSheet.
x
Syntax: How to Identify a Grand Total, Subtotal, or Subtotal Calculation
TYPE=type, [BY=sortfield] [coltype=column]
where:
- type
Identifies a subtotal or total. Select from:
GRANDTOTAL which
is a grand total (generated by COLUMN-TOTAL, SUBTOTAL, SUB-TOTAL,
RECOMPUTE, or SUMMARIZE).
SUBTOTAL which
is a subtotal (generated by SUBTOTAL, SUB-TOTAL, RECOMPUTE, or SUMMARIZE).
RECAP which
is a subtotal calculation (generated by ON sortfield RECAP
or ON sortfield COMPUTE).
- BY
If you have requests with multiple BY fields, and two or
more have subtotal commands associated with them, you can identify
each field using the BY identifier. This is helpful when you want
to format each subtotal differently or when you want to format only
one subtotal.
You need to include the BY identifier only if
you have multiple BY fields in your request.
- sortfield
Specifies the BY field associated with one of a report's
several subtotal commands. Use the fieldname for the value (BY=fieldname).
- coltype
Identifies a specific column for formatting. When you include
the COLUMN or ACROSSCOLUMN identifier in your declaration, only
the subtotal values receive the formatting; the labeling
text will not. Values can be:
COLUMN which
is a display column (generated by PRINT, LIST, SUM, or COUNT) or
a computed column (generated by COMPUTE).
ACROSSCOLUMN where
every instance of a display or computed column that is repeated
across a horizontal sort (ACROSS) row.
If there are several
columns being totaled or subtotaled by one command, and you do not
specify a column in the StyleSheet, the formatting will be applied
to the totals or subtotals for all of the columns. It will
also be applied to the labeling text for the total and subtotal
values.
- column
Specifies the column whose totals or subtotals you wish to
format. For a list of values, see How to Identify an Entire Column.
Example: Identifying Subtotals and the Grand Total
The
following illustrates how to identify subtotals and the grand total
in a report request. In this example, only subtotal values in the
QUANTITY and LINE_COGS fields are formatted, so the COLUMN attribute
is included in the StyleSheet declarations.
The grand total
in this request is generated by COLUMN-TOTAL.
Since
there are two SUBTOTAL commands associated with two of the three
BY fields (PLANT and ORDER_NO), the BY attribute is also included
in each declaration to ensure the formatting is applied to the correct
value.
TABLE FILE CENTORD
SUM QUANTITY LINE_COGS AS 'Line Cost of, Goods Sold'
BY PLANT AS 'Plant'
BY ORDER_NUM AS 'Order,Num'
BY PRODNAME
ON PLANT SUBTOTAL AS 'Total:'
ON ORDER_NUM SUBTOTAL AS 'Total:'
WHERE ORDER_NUM EQ '35774' OR '48041'
WHERE PLANT EQ 'BOS'
ON TABLE SET PAGE-NUM OFF
ON TABLE HOLD FORMAT HTML
ON TABLE SET STYLE *
TYPE=REPORT, GRID=OFF,$
TYPE=SUBTOTAL, BY=PLANT, COLUMN=LINE_COGS, STYLE=BOLD+ITALIC,  COLOR=BLUE,$
TYPE=SUBTOTAL, BY=ORDER_NUM, COLUMN=QUANTITY, STYLE=BOLD, SIZE=11,$
TYPE=GRANDTOTAL, COLUMN=QUANTITY, STYLE=ITALIC, SIZE=11,$ENDSTYLE
END
The output is:
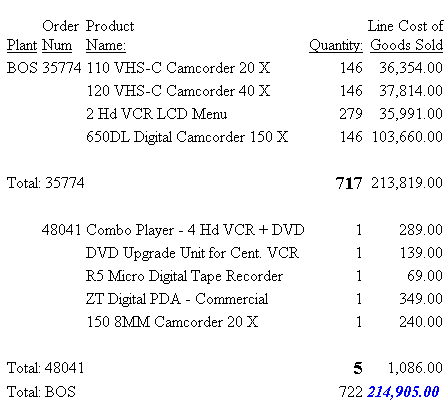
Note:
- To style the entire
grand total row, remove the COLUMN attribute from the StyleSheet
declaration.
- To produce the same
results, you can alternatively use the values N5, P5, or C3 for
the COLUMN attribute in the StyleSheet declaration.
- To style an entire
subtotal row, remove the COLUMN and BY attributes from the StyleSheet
declaration.
- To produce the same
results you can, alternatively, use the values COLUMN=N6, COLUMN=P6,
or COLUMN=C3 for the COLUMN=LINE_COGS attribute.
- To produce the same
results you can, alternatively, use the values COLUMN=N4, COLUMN=P4,
or COLUMN=C1 for the COLUMN=QUANTITY attribute.
Example: Identifying a Subtotal Calculation (RECAP/COMPUTE)
The following illustrates how to identify
a subtotal calculation created with a RECAP or COMPUTE phrase. In
this example, the subtotal calculation is generated with ON PLANT RECAP
QTY/F6=QUANTITY. The relevant StyleSheet declaration is highlighted
in the request.
Note: If
there are multiple RECAP or COMPUTE fields in your request, you
can distinguish them by adding BY=fieldname to the StyleSheet
declaration.
TABLE FILE CENTORD
SUM QUANTITY LINEPRICE LINE_COGS AS 'Line Cost of, Goods Sold'
BY PLANT AS 'Plant' BY ORDER_NUM
ON PLANT RECAP QTY/F6=QUANTITY;
WHERE PLANT EQ 'BOS'
WHERE ORDER_NUM GT '60000' AND ORDER_NUM LT '70000'
ON TABLE SET PAGE-NUM OFF
ON TABLE HOLD FORMAT HTML
ON TABLE SET STYLE *
TYPE=REPORT, GRID=OFF, $
TYPE=RECAP, STYLE=BOLD+ITALIC, $
ENDSTYLE
END
The output is:
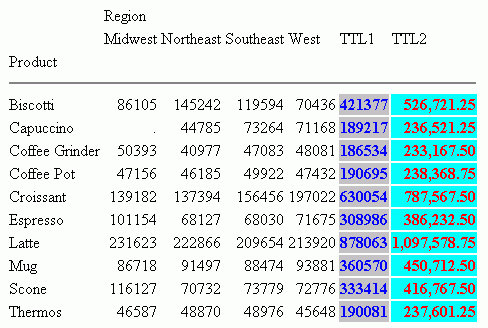
Example: Styling Multiple RECAP Statements in a Matrix
You
can style multiple RECAP commands in a matrix when the RECAP statements
are placed after the last ACROSS value:
TABLE FILE GGSALES
SUM UNITS
BY PRODUCT
ACROSS REGION
RECAP
TTL1/I8=C1+C2+C3+C4;
TTL2/D12.2=TTL1*1.25;
ON TABLE HOLD FORMAT HTML
ON TABLE SET STYLE *
TYPE=DATA, COLUMN=TTL1 (*), COLOR=BLUE, BACKCOLOR=SILVER, STYLE=BOLD, $
TYPE=DATA, COLUMN=TTL2 (*), COLOR=RED, BACKCOLOR=AQUA, STYLE=BOLD, $
ENDSTYLE
END
The output is:
x
Identifying Tags for SUBTOTAL and GRANDTOTAL Lines
The tag is the text that is displayed in the leftmost portion
of each SUBTOTAL and GRANDTOTAL row in a report. The tag is used
to identify the type of data represented within this row. The text
used to generate this tag can be customized by adding an AS name
to the SUBTOTAL syntax.
You can define styling for the subtotal and grand total tag separately
from the rest of the row. Text attributes available for the tag,
including font, color, size, and style, can be used to differentiate
and highlight the tags. Additionally, styling can be applied that
turns tags into drill-down links.
Styling is supported for text attributes only. Cell or column
features, such as borders, background color, or justification are
not supported.
This feature is available for PDF, DHTML, PS, HTML, AHTML, PPTX,
XLSX, and EXL2K formats.
x
Syntax: How to Style Subtotal and Grand Total Tags
TYPE={SUBTOTAL|GRANDTOTAL}, OBJECT=TAG,
   [FONT=font], [SIZE=size], [STYLE=style],
   [COLOR={color|RGB({r						g						b|#hexcolor})],
   [drilltype=drillparms], $
where:
- font
Is the name of the font.
- size
Is the point size of the font.
- style
Is the font style, for example bold, italic, or bold + italic.
- color
Is a color name.
- r g b
Specifies the font color using a mixture of red, green, and
blue.
(r g b) is the desired intensity of red, green, and
blue, respectively. The values are on a scale of 0 to 255, where
0 is the least intense and 255 is the most intense. Note that using
the three color components in equal intensities results in shades
of gray.
- #hexcolor
Is the hexadecimal value for the color. For example, FF0000
is the hexadecimal value for red. The hexadecimal digits can be
in uppercase or lowercase and must be preceded by a pound sign (#).
- linktype
Is any valid link attribute, for example, URL=. For more
information about links, see Advanced StyleSheet Features.
- drillparms
Are valid attribute values for the type of link.
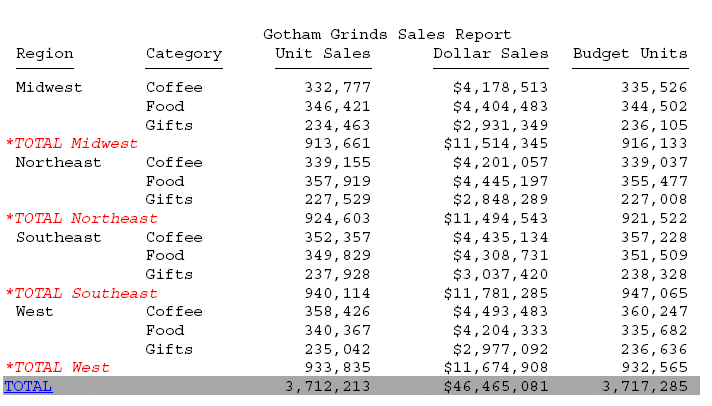
Example: Styling SUBTOTAL and GRANDTOTAL Tags
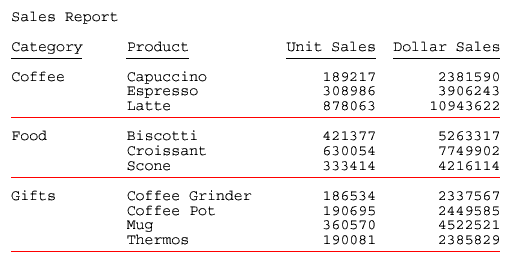
The following request against the GGSALES
data source generates subtotal and grand total rows. The tags for
the subtotal rows are in italics and are red. The tag for the grand total
row has a drill-down link to a URL:
TABLE FILE GGSALES
SUM UNITS/D8C DOLLARS/D12CM BUDUNIT/D8C BUDDOLLARS/D12CM
BY REGION
BY CATEGORY
ON REGION SUBTOTAL
HEADING CENTER
"Gotham Grinds Sales Report"
ON TABLE SET HTMLCSS ON
ON TABLE HOLD FORMAT PDF
ON TABLE SET DROPBLNKLINE ALL
ON TABLE SET PAGE-NUM OFF
ON TABLE SET STYLE *
TYPE=SUBTOTAL, OBJECT=TAG,STYLE=ITALIC,COLOR=RED,$
TYPE=GRANDTOTAL, BACKCOLOR='LIGHT GREY',$
TYPE=GRANDTOTAL, OBJECT=TAG,URL='http://www.informationbuilders.com',$
ENDSTYLE
END
The output is:
xIdentifying a Column or Row Title
Within a StyleSheet, you can identify a report's column
titles and horizontal sort (ACROSS) values to format. The following
example illustrates where column titles and horizontal sort values
are stored in a report, and which TYPE values you use to identify
them.
TABLE FILE EMPLOYEE
SUM GROSS AND DED_AMT
ACROSS DEPARTMENT BY PAY_DATE
END
Note: Since this request simply illustrates how to identify
column titles and horizontal sort values in a report, it omits a
StyleSheet.
x
Syntax: How to Identify a Column Title
TYPE=TITLE, [COLUMN=column]
where:
- COLUMN
Is used to specify one or more column titles. If you omit
this attribute and value, the formatting will be applied to all
of the report's column titles.
- column
Specifies the column whose title you wish to format. For
column values, see How to Identify an Entire Column.
x
Syntax: How to Identify a Horizontal Sort Title or Value
TYPE={ACROSSTITLE|ACROSSVALUE}, [ACROSS=column]where:
- ACROSSTITLE
Specifies a horizontal sort (ACROSS) title.
- ACROSSVALUE
Specifies a horizontal sort (ACROSS) value.
Although
horizontal sort values are not technically titles, they often function
as titles that categorize the column titles appearing beneath them.
- ACROSS
Is used to specify titles or values for a specific horizontal
sort field. If you omit this attribute and value, the formatting
will be applied to the titles or values of all of the report's horizontal
sort fields.
- column
Specifies the horizontal sort (ACROSS) field whose title
or values you wish to format. For values you can assign to this
attribute, see How to Identify a Row of Horizontal Sort (ACROSS) Data.
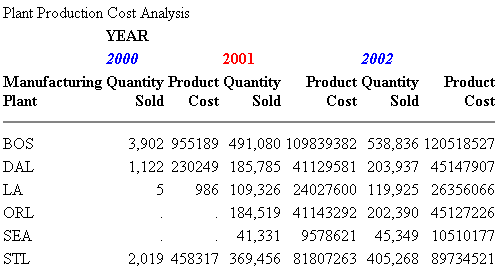
Example: Identifying Column Titles and Horizontal Sort (ACROSS) Values
The
following illustrates how to identify vertical sort titles, horizontal
sort titles, and horizontal sort values. The vertical sort titles
(TYPE=TITLE) are Manufacturing Plant, Quantity Sold and Product
Cost; the horizontal sort title (TYPE=ACROSSTITLE) is Year; and
the horizontal sort values (TYPE=ACROSSVALUE) are 1999, 2000, and
2001. The StyleSheet declarations that identify these components
are highlighted in the request.
TABLE FILE CENTORD
SUM QUANTITY AS 'Quantity,Sold' LINE_COGS/I9  AS 'Product,Cost'
BY PLANT
ACROSS YEAR
WHERE YEAR EQ '2000' OR '2001' OR '2002'
HEADING
"Plant Production Cost Analysis"
ON TABLE SET PAGE-NUM OFF
ON TABLE HOLD FORMAT HTML
ON TABLE SET STYLE *
TYPE=REPORT, GRID=OFF,$
TYPE=TITLE, STYLE=BOLD, $
TYPE=ACROSSTITLE, STYLE=BOLD, $
TYPE=ACROSSVALUE, STYLE=BOLD+ITALIC, COLOR=BLUE, $
TYPE=ACROSSVALUE, COLUMN=N4, STYLE=BOLD, COLOR=RED, $
ENDSTYLE
END
The output is:
x
Syntax: How to Identify Free Text in an FML Report
TYPE=FREETEXT, LABEL={Rn|label}where:
- Rn
Is an implicit row label. To determine the value of n,
count the number of rows up to and including the desired row.
- label
Is an explicit row label.
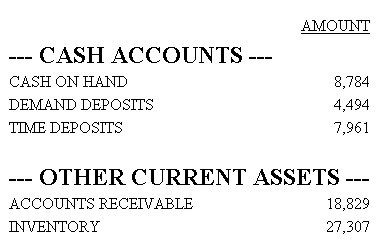
Example: Identifying Free Text in an FML Report
The
following illustrates how to identify free text in an FML report.
In this example, the free text are the rows, CASH ACCOUNTS and OTHER
CURRENT ASSETS. The relevant StyleSheet declarations are highlighted:
TABLE FILE LEDGER
SUM AMOUNT FOR ACCOUNT
" --- CASH ACCOUNTS ---" LABEL CA            OVER
1010 AS 'CASH ON HAND'                       OVER
1020 AS 'DEMAND DEPOSITS'                    OVER
1030 AS 'TIME DEPOSITS'                      OVER
" "                                          OVER
" --- OTHER CURRENT ASSETS ---" LABEL OCA    OVER
1100 AS 'ACCOUNTS RECEIVABLE'                OVER
1200 AS 'INVENTORY'
ON TABLE SET PAGE-NUM OFF
ON TABLE HOLD FORMAT HTML
ON TABLE SET STYLE *
TYPE=REPORT, GRID=OFF, $
TYPE=FREETEXT, LABEL=CA, STYLE=BOLD, SIZE=12, $
TYPE=FREETEXT, LABEL=OCA, STYLE=BOLD, SIZE=12, $
ENDSTYLE
END
The output is:
x
Syntax: How to Create a Custom Report Title
Add the
following declaration to your StyleSheet
TYPE=REPORT, TITLETEXT='title', $
where:
- title
Is the text for your title.
The maximum amount of
characters for:
- The worksheet
tab name in an EXL2K report is128. Any text that exceeds 128 characters
will be truncated.
- The browser
title for an HTML report is 95. This is a limit imposed by the browser.
Text
specified in the title is placed in the file as is and is not encoded.
Special characters, such as <, >, &, and so on, should
not be used as they have special meaning in HTML and may produce
unpredictable results.
Note: The words, Microsoft
Internet Explorer are always appended to any HTML report title.
For
an example of using this technique, see Using Excel Display Formats: XLSX, EXL2K, EXL97, EXCEL.
xIdentifying a Heading or Footing
Within a StyleSheet, you can identify a report's headings
and footings, and the individual lines, text strings, and fields
within them, in order to format them.
You can use the <TABLASTPAGE system variable to insert the
total number of pages in a heading or footing. For example, if you
want to add a footing in your report that reads, Page 1 of 5,
you can use the <TABLASTPAGE system variable in conjunction with the
<TABPAGENO system variable to do so.
You can also the <BYLASTPAGE system variable to display the
number of pages of output within each sort group when a report uses
the REPAGE option to reset the page numbers for each sort group.
If the REPAGE option is not used in the report, the total number of
pages in the report (<TABLASTPAGE variable) is used for <BYLASTPAGE.
The following example illustrates where a report heading (TABHEADING),
a page heading (HEADING), a sort heading (SUBHEAD), a sort footing
(SUBFOOT), and a report footing (TABFOOTING) are stored in a report,
and which TYPE values you use to identify them.
TABLE FILE EMPLOYEE
PRINT CURR_SAL HIRE_DATE
BY LAST_NAME
BY FIRST_NAME
ON TABLE SUBHEAD
"CONFIDENTIAL INFORMATION"
"SWIFTY INFORMATION GROUP - EMPLOYEE LIST BY DEPARTMENT"
HEADING CENTER
"</1>EMPLOYEE LIST FOR DEPARTMENT: <DEPARTMENT"
ON LAST_NAME SUBHEAD
"ID: <EMP_ID"
ON LAST_NAME SUBFOOT
"** REVIEW SALARY FOR <FIRST_NAME <LAST_NAME"
FOOTING
"CONFIDENTIAL INFORMATION"
ON TABLE SUBFOOT
"</1>***END OF REPORT***"
END
The output is:
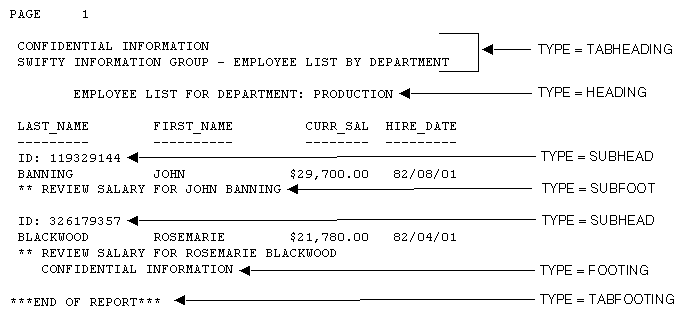
Note: Since this request simply illustrates how to identify
different types of headings and footings, it omits a StyleSheet.
x
Syntax: How to Identify a Heading or Footing
TYPE=headfoot, [BY=sortcolumn]
where:
- headfoot
Identifies a heading or footing. Select from:
TABHEADING which
is a report heading. This appears once at the beginning of the report
and is generated by ON TABLE SUBHEAD.
TABFOOTING which
is a report footing. This appears once at the end of the report
and is generated by ON TABLE SUBFOOT.
HEADING which
is a page heading. This appears at the top of every report page
and is generated by HEADING.
FOOTING which
is a page footing. This appears at the bottom of every report page
and is generated by FOOTING.
SUBHEAD which
is a sort heading. This appears at the beginning of a vertical (BY)
sort group (generated by ON sortfield SUBHEAD).
SUBFOOT which
is a sort footing. This appears at the end of a vertical (BY) sort
group (generated by ON sortfield SUBFOOT).
- BY
When there are several sort headings or sort footings, each
associated with a different vertical sort (BY) column, you can identify
which sort heading or sort footing you wish to format.
If
there are several sort headings or sort footings associated with
different vertical sort (BY) columns, and you omit this attribute
and value, the formatting will be applied to all of the sort headings
or footings.
- sortcolumn
Specifies the vertical sort (BY) column associated with one
of the report's sort headings or sort footings.
x
Syntax: How to Identify an Individual Line in a Heading or Footing
TYPE=type, LINE=line_#
where:
- type
Identifies a type of heading or footing. Select from HEADING,
FOOTING, TABHEADING, TABFOOTING, SUBHEAD, or SUBFOOT. For details,
see How to Identify a Heading or Footing.
- line_#
Identifies a line by its position in the heading or footing.
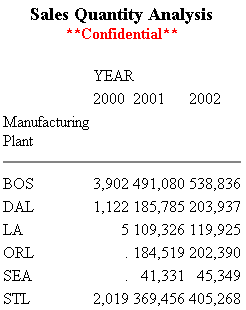
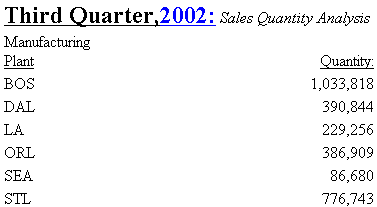
Example: Identifying an Individual Line in a Heading
The
following example illustrates how to format individual lines in
a heading. Heading line 1 (Sales Quantity Analysis) is formatted
in bold, point size 11. Heading line 2 (**Confidential**) is formatted
in bold and red. The relevant StyleSheet declarations are highlighted
in the request.
TABLE FILE CENTORD
HEADING
"Sales Quantity Analysis"
"**Confidential**"
" "
SUM QUANTITY
ACROSS YEAR
BY PLANT
ON TABLE SET PAGE-NUM OFF
ON TABLE HOLD FORMAT HTML
ON TABLE SET STYLE *
TYPE=REPORT, GRID=OFF, $
TYPE=HEADING, LINE=1, SIZE=11, STYLE=BOLD,$
TYPE=HEADING, LINE=2, COLOR=RED, STYLE=BOLD,$
TYPE=HEADING, JUSTIFY=CENTER,$
ENDSTYLE
END
The output is:
x
Syntax: How to Identify a Text String in a Heading or Footing
TYPE=type, [LINE=line_#], [OBJECT=TEXT], ITEM=item_#
where:
- type
Identifies a type of heading or footing. Select from HEADING,
FOOTING, TABHEADING, TABFOOTING, SUBHEAD, or SUBFOOT. For details,
see Identifying a Heading or Footing.
- line_#
Identifies a line by its position in the heading or footing.
You need to include the LINE attribute only if you have a multi-line
heading or footing.
- TEXT
Formats only text strings and Dialogue Manager variables
(also known as &variables). It is not necessary to use OBJECT=TEXT
in your declaration unless you are styling both text strings and
embedded fields in the same heading or footing.
- item_#
Identifies an item by its position in a line.
If you
need to apply formatting to several parts of a continuous text string
that appears on one line, you can break the header or footer into
multiple parts using spot markers. Place the spot marker after the
text string you wish to specify. The <+0> spot marker will
not add any additional spaces to your heading or footing. When using
spot markers, text is divided as follows:
For
an example, see How to Identify a Text String in a Heading or Footing.
The position
value also depends on whether you are using the OBJECT attribute
or not. If you are using:
- OBJECT=TEXT,
count only text strings from left to right.
- No OBJECT, count
text strings and embedded field values from left to right.
Example: Identifying a Text String in a Heading Using Spot Markers
The
following illustrates how to apply different formats to text strings
in a heading using spot markers. The spot markers used in this example
are <+0>, since they do not add any spaces. The relevant StyleSheet
declarations are highlighted in the request.
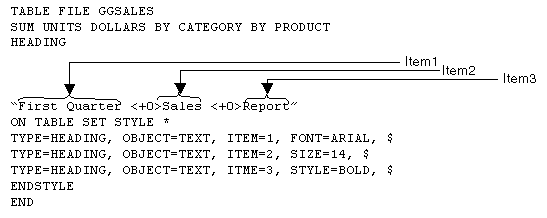
TABLE FILE CENTORD
HEADING
"Third Quarter,<+0>2002:<+0> Sales Quantity Analysis"
SUM QUANTITY  BY PLANT
ON TABLE SET PAGE-NUM OFF
ON TABLE HOLD FORMAT HTML
ON TABLE SET STYLE *
TYPE=REPORT, GRID=OFF, $
TYPE=HEADING, OBJECT=TEXT, ITEM=1, STYLE=BOLD+UNDERLINE, SIZE=12, $
TYPE=HEADING, OBJECT=TEXT, ITEM=2, COLOR=BLUE, SIZE=12,
     STYLE=BOLD+UNDERLINE, $
TYPE=HEADING, OBJECT=TEXT, ITEM=3, STYLE=ITALIC,$
ENDSTYLE
END
The output is:
x
Syntax: How to Identify an Embedded Field in a Heading or Footing
TYPE=type, [LINE=line_#], OBJECT=FIELD, [ITEM=item #]
where:
- type
Identifies a type of heading or footing. Select from HEADING,
FOOTING, TABHEADING, TABFOOTING, SUBHEAD, or SUBFOOT. For details,
see Identifying a Heading or Footing.
- line_#
Identifies a line by its position in the heading or footing.
You need to include the LINE attribute only if you have a multi-line
heading or footing.
- item_#
Identifies an item by its position in a line.
If you
have more than one embedded field in a heading or footing, you must
specify the field you wish to format by giving the item number.
Count items from left to right. Do not include text fields in the
count. You do not need to specify the item number if there is only
one embedded field in the heading or footing.
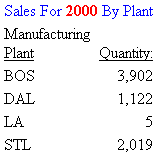
Example: Identifying Embedded Fields in a Heading
The
following illustrates how to format an embedded field in a heading.
Notice that the item number is not specified in the StyleSheet declaration
since there is only one embedded field in the heading. The relevant
StyleSheet declaration is highlighted in the request.
TABLE FILE CENTORD
HEADING
"Sales For <YEAR By Plant"
SUM QUANTITY  BY PLANT
WHERE YEAR EQ 2000
ON TABLE SET PAGE-NUM OFF
ON TABLE HOLD FORMAT HTML
ON TABLE SET STYLE *
TYPE=REPORT, GRID=OFF, $
TYPE=HEADING, OBJECT=TEXT, COLOR=BLUE,$
TYPE=HEADING, OBJECT=FIELD, COLOR=RED, STYLE=BOLD,$
ENDSTYLE
END
The output is:
x
Syntax: How to Insert the Total Page Count
To insert
the total number of pages, add the following to your request:
<TABLASTPAGE
Note
that TABLASTPAGE is not supported with Excel 2000.
Note:
- TABLASTPAGE does not adjust for changes in FOCFIRSTPAGE or for
the REPAGE command. For example, if the report has 10 pages and
the user uses FOCFIRSTPAGE to set the first page number to 3 rather
than 1, the value of TABLASTPAGE will still be 10.
- TABLASTPAGE is supported only for a single report, not compound
reports. A separate page count is generated for each report in a
compound report.
- TABLASTPAGE is supported only for styled reports such as HTML,
PDF, and PS. it is not supported for EXL2K, WP, or DOC.
- TABLASTPAGE causes a second pass through the report results,
first to calculate the last page then to print it with TABPAGENO
(even when SQUEEZE=OFF).
- TABLASTPAGE does not support the system (external) sort.
- GRAPH FILE does not support TABLASTPAGE.
- TABLEF is not supported with TABLASTPAGE.
- The variables TABPAGENO and TABLASTPAGE cannot be used to define
styling with conditional styling (WHEN).
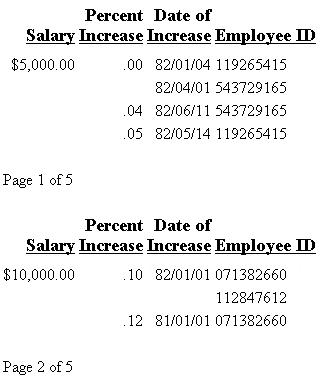
Example: Inserting the Current Page Number and the Total Page Count
The
following illustrates how to add the current page number and the
total page count to a report. The relevant syntax is highlighted
in the request.
TABLE FILE EMPLOYEE
PRINT EMP_ID AS 'Employee ID'
BY SALARY IN-GROUPS-OF 5000 AS 'Salary'
BY PCT_INC AS 'Percent,Increase'
BY DAT_INC AS 'Date of,Increase'
ON SALARY PAGE-BREAK
ON TABLE SET PAGE-NUM OFF
ON TABLE HOLD FORMAT HTML
ON TABLE SET STYLE *
TYPE=REPORT, GRID=OFF, $
TYPE=TITLE, STYLE=BOLD, SIZE=11, $
ENDSTYLE
FOOTING
"Page <TABPAGENO of <TABLASTPAGE"
END
The first two pages of output are:
x
Syntax: How to Display the Total Number of Pages Within Each Sort Group
The request must have the following
syntax and hold the output in a styled output format:
BY sortfield REPAGE
The
heading or footing can use the following syntax to display “Page x of y”
{HEADING|FOOTING}
"Page <TABPAGENO of <BYLASTPAGE"
where:
- sortfield
Is the sort field that has the REPAGE option. A PAGE-BREAK
is required on the same sort field or a lower level sort field.
PAGE-BREAK starts a new page for each sort break. REPAGE resets
the page number to 1 for each sort break.
- <TABPAGENO
Is the current page number.
- <BYLASTPAGE
Is the last page number before the repage.
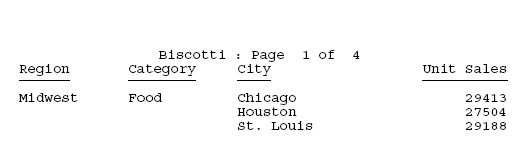
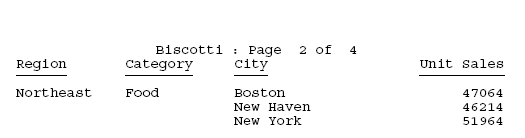
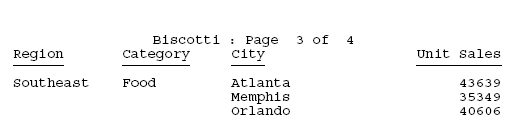
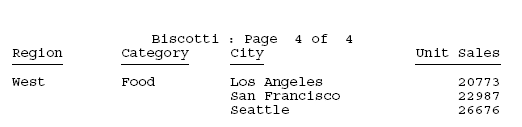
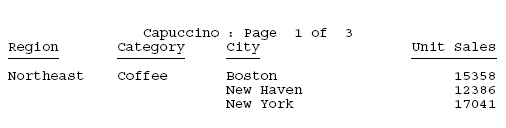
Example: Paginating Within a Sort Group
The following request against the GGSALES
data source sorts by product, region, category, and city. It resets
the pagination each time the product changes. The heading prints
the current page number and the total within each product group:
TABLE FILE GGSALES
HEADING CENTER
"<PRODUCT : Page <TABPAGENO of <BYLASTPAGE "
SUM UNITS
BY PRODUCT NOPRINT REPAGE
BY REGION PAGE-BREAK
BY CATEGORY
BY CITY

ON TABLE HOLD FORMAT PDF
END
The following partial output shows that
the page number resets to 1 when the product changes and that the
BYLASTPAGE variable displays the total number of pages for each product:
xIdentifying a Page Number, Underline, or Skipped Line
In a report, you can identify and format page numbers,
underlines, and skipped lines using the PAGENUM, SKIPLINE, and UNDERLINE
attributes.
You can make a detailed tabular report easier to read by separating
sections with blank lines or underlines.
You cannot add blank lines or underlines to an HTML report that
displays a grid. You can add blank lines or underlines if you set
the GRID attribute to OFF.
When inserting blank lines, the setting of the LINES parameter
should be at least one less than the setting of the PAPER parameter,
to allow room for blanks after the display of data on a page.
Note that although you can insert skipped lines and underlines
in an HTML report, formatting is not supported.
The following illustrates where the PAGENUM, UNDERLINE, and SKIPLINE
components appear in a report, and which TYPE values you use to
identify them.
TABLE FILE CENTORD
HEADING
"Sales By Plant"
SUM QUANTITY
BY PLANT BY YEAR
WHERE PLANT EQ 'BOS' OR 'DAL'
ON YEAR UNDER-LINE
ON PLANT SKIP-LINE
ON TABLE HOLD FORMAT PDF
END
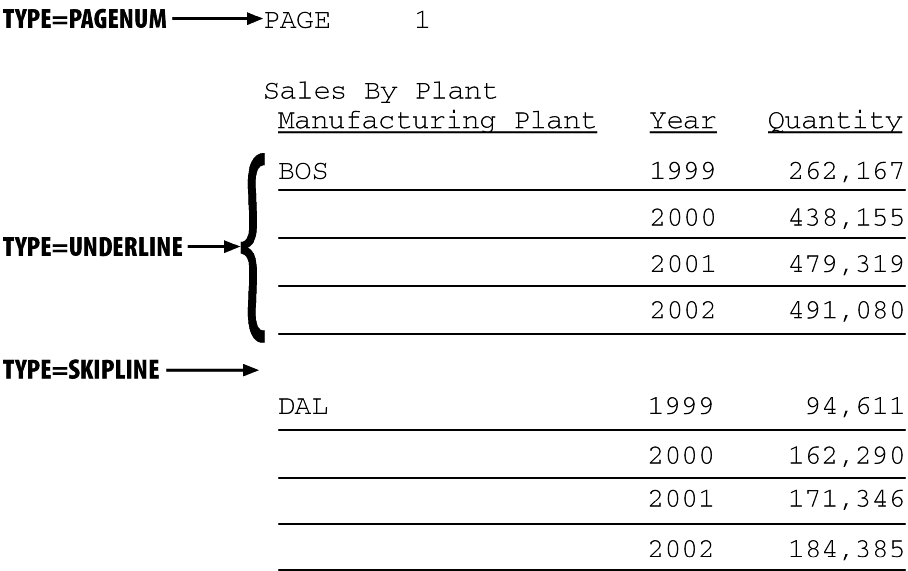
Note: Since this request simply illustrates where the
components appear in a report, it omits a StyleSheet.
x
Syntax: How to Identify a Page Number, Underline, or Skipped Line
TYPE=type
where:
- type
Identifies the report component. Select from:
PAGENUM which
identifies page numbers. Note that the TABPAGENO variable is a component
of the heading or footing in which it appears and can be formatted
as a subcomponent of that heading or footing.
SKIPLINE which
denotes skipped lines generated by ON field SKIP-LINE. This
is not supported for reports in HTML format.
UNDERLINE which
identifies underlines generated by ON field UNDER-LINE, or
by BAR in a Financial Modeling Language (FML) report. This is not
supported for reports in HTML format.
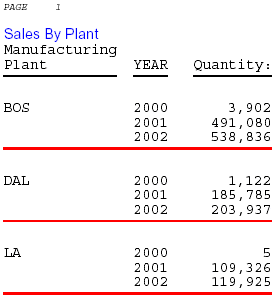
Example: Identifying Underlines and Page Numbers
The
following illustrates how to identify underlines and page numbers
in a report request. The relevant StyleSheet declarations appear
in boldface in the request.
Note
that this report is formatted in PDF, since formatting is not supported
for underlines in an HTML report.
TABLE FILE CENTORD
HEADING
"Sales By Plant"
SUM QUANTITY
BY PLANT BY YEAR
WHERE PLANT EQ 'BOS' OR 'DAL' OR 'LA'
ON PLANT UNDER-LINE SKIP-LINE
ON TABLE HOLD FORMAT PDF
ON TABLE SET STYLE *
TYPE=REPORT, GRID=OFF, $
TYPE=HEADING, OBJECT=TEXT, COLOR=BLUE, FONT=ARIAL,$
TYPE=PAGENUM, STYLE=ITALIC, SIZE=8,$
TYPE=UNDERLINE, COLOR=RED,$
ENDSTYLE
END
The output is:
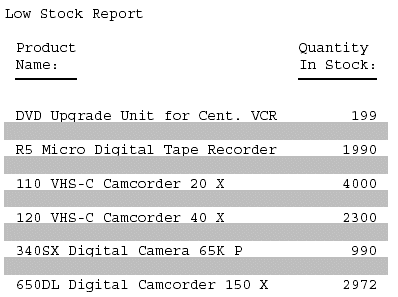
Example: Identifying Skipped Lines
The
following illustrates how to identify skipped lines in a report.
The relevant StyleSheet declaration is highlighted in the request.
TABLE FILE CENTINV
HEADING
"Low Stock Report"
" "
SUM QTY_IN_STOCK
WHERE QTY_IN_STOCK LT 5000
BY PRODNAME
ON PRODNAME SKIP-LINE
ON TABLE SET PAGE-NUM OFF
ON TABLE HOLD FORMAT PDF
ON TABLE SET STYLE *
TYPE=SKIPLINE, BACKCOLOR=SILVER, $
ENDSTYLE
END
The output is:
x
Syntax: How to Extend an Underline to the Entire Report Column
By
default, underlines for column titles on a report extend only from
the beginning to the end of the column title text. You can extend
the underline to the entire report column in styled report output
using the EXTUNDERLINE option in your FOCUS StyleSheet. EXTUNDERLINE is an
option of the STYLE attribute for the TITLE report component. It
is supported for formats DHTML, PDF, PS, and PPT.
TYPE = TITLE, [COLUMN = colspec,] STYLE = [+|-]EXTUNDERLINE ,$
where:
- colspec
Is any valid column specification.
- +EXTUNDERLINE
Adds the EXTUNDERLINE option to the inherited text style
or specifies a combination of text styles (for example, STYLE=BOLD+UNDERLINE).
- -EXTUNDERLINE
Removes the EXTUNDERLINE option from the inherited text style.
x
Reference: Usage Notes for the EXTUNDERLINE Attribute
- HTML format
is not supported because the browser calculates the column width
and renders the report.
- GRID=ON and
EXTUNDERLINE are mutually exclusive since the GRID line spans the width
of the column. GRID overrides any styling specified for the column
title underline.
Example: Extending an Underline to the Entire Report Column
The following request against the GGSALES
data source sums dollar sales by city and by date:
DEFINE FILE GGSALES
YEAR/YY = DATE;
MONTH/M = DATE;
END
TABLE FILE GGSALES
SUM DOLLARS
BY DATE
BY CITY
WHERE YEAR EQ 1997
WHERE MONTH FROM 01 TO 05
WHERE CITY EQ 'Seattle' OR 'San Francisco' OR 'Los Angeles'
ON TABLE SET PAGE NOPAGE
ON TABLE HOLD FORMAT DHTML
END
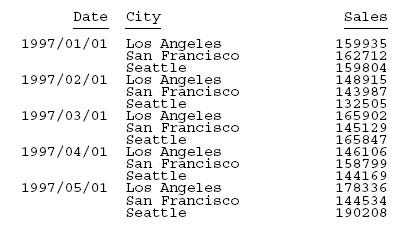
The output shows that
only the column titles are underlined:
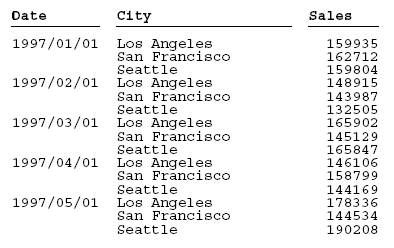
To underline entire columns, generate
the output in a format that can be styled and use the EXTUNDERLINE
option in the STYLE attribute for the TITLE component. For example,
the following request creates DHTML output in which the column titles
are in boldface and left justified, and the underline is extended
to the entire report columns:
DEFINE FILE GGSALES
YEAR/YY = DATE;
MONTH/M = DATE;
END
TABLE FILE GGSALES
SUM DOLLARS
BY DATE
BY CITY
WHERE YEAR EQ 1997
WHERE MONTH FROM 01 TO 05
WHERE CITY EQ 'Seattle' OR 'San Francisco' OR 'Los Angeles'
ON TABLE SET PAGE NOPAGE
ON TABLE HOLD FORMAT DHTML
ON TABLE SET STYLE *
TYPE=TITLE, STYLE= BOLD +EXTUNDERLINE, JUSTIFY=LEFT $
ENDSTYLE
END
The output is:
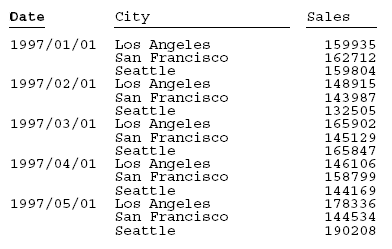
The
following version of the request makes the EXTUNDERLINE and JUSTIFY=LEFT options
the default for the TITLE component, then makes the Date column
title bold and removes the extended underline from that column:
DEFINE FILE GGSALES
YEAR/YY = DATE;
MONTH/M = DATE;
END
TABLE FILE GGSALES
SUM DOLLARS AS 'Sales'
BY DATE
BY CITY
WHERE YEAR EQ 1997
WHERE MONTH FROM 01 TO 05
WHERE CITY EQ 'Seattle' OR 'San Francisco' OR 'Los Angeles'
ON TABLE SET PAGE NOPAGE
ON TABLE HOLD FORMAT DHTML
ON TABLE SET STYLE *
TYPE=TITLE,STYLE= EXTUNDERLINE, JUSTIFY=LEFT ,$
TYPE=TITLE,COLUMN= DATE, STYLE= -EXTUNDERLINE +BOLD ,$
ENDSTYLE
END
The output is:
x
Reference: Section Separation Features
|
Feature
|
Description
|
Applies to
|
|---|
SKIP-LINE |
Adds a blank line.
|
HTML (requires GRID=OFF)
PDF
PS
|
TYPE=SKIPLINE |
Formats a blank line.
|
PDF
PS
|
UNDER-LINE |
Underlines a sort group.
|
HTML (requires GRID=OFF)
PDF
PS
|
TYPE=UNDERLINE |
Formats an underline.
|
PDF
PS
|
STYLE={+|-}UNDERLINE |
Adds an underline to a report component,
or removes an underline from a report component other than a column
title.
|
HTML
PDF
PS
|
BAR AS '{-|=}' |
Selects a light or heavy underline in an
FML report.
|
HTML
PDF (displays single or double
underline)
|
x
Syntax: How to Format a Blank Line
TYPE=SKIPLINE, attribute=value, $
where:
- attribute
Is a valid StyleSheet attribute.
- value
Is the value of the attribute.
Note: This
option is supported for PDF, PS, and HTML reports (when used in conjunction
with internal cascading style sheets).
x
Syntax: How to Format an Underline
TYPE=UNDERLINE ... COLOR={color|RGB} (r g b), $where:
- UNDERLINE
Denotes underlines generated by ON fieldname UNDER-LINE.
- COLOR
Specifies the color of the underline. If the display or output
device does not support colors, it substitutes shades of gray. The
default value is black.
- color
Is one of the supported color values.
- RGB
Specifies the text color using a mixture of red, green, and blue.
- (r g b)
Is the desired intensity of red, green, and blue, respectively.
The values are on a scale of 0 to 255, where 0 is the least intense
and 255 is the most intense.
Note that using the three-color
components in equal intensities results in shades of gray. For more
information, see Color Values in a Report.
Note: This
option is supported for PDF, PS, and HTML reports (when used in conjunction
with internal cascading style sheets).
Example: Formatting a Sort Group Underline
This
request uses UNDERLINE to change the default color of an underline
from black to red.
TABLE FILE GGSALES
SUM UNITS DOLLARS
BY CATEGORY BY PRODUCT
HEADING
"Sales Report"
" "
ON CATEGORY UNDER-LINE
ON TABLE SET PAGE-NUM OFF
ON TABLE HOLD FORMAT PDF
ON TABLE SET STYLE *
TYPE=UNDERLINE, COLOR=RED, $
ENDSTYLE
END
The result is an eye-catching separation between
sort group values. The online PDF report appears as:
x
Syntax: How to Add or Remove a Report Component Underline
TYPE=type, [subtype,] STYLE=[+|-]UNDERLINE, $
where:
- type
Is the report component.
- subtype
Are additional attributes, such as COLUMN, ACROSS, or ITEM,
needed to identify the report component.
- +
Adds an underline to the inherited text style or specifies
a combination of text styles (for example, STYLE=BOLD+UNDERLINE). + is the default value.
- -
Removes an underline from an inherited text style.
For
more information, see Identifying Report Components.
x
Syntax: How to Remove an Underline From a Column Title
This
syntax applies to an HTML report with internal cascading style sheet.
TYPE=TITLE, [COLUMN=column,] STYLE=-UNDERLINE, $
where:
- COLUMN=column
Specifies a column.
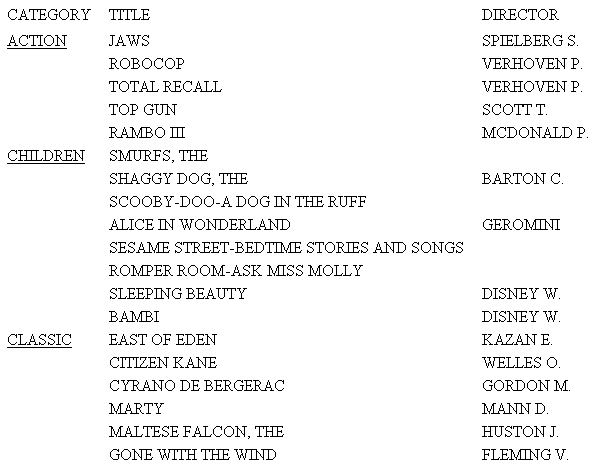
Example: Adding Column Underlines and Removing Column Title Underlines
This
request adds underlines to the values of the column CATEGORY and
removes the default underlines from the column titles in an HTML
report with an internal cascading style sheet.
SET HTMLCSS = ON
TABLE FILE MOVIES
PRINT TITLE DIRECTOR
BY CATEGORY
ON TABLE SET PAGE-NUM OFF
ON TABLE HOLD FORMAT HTML
ON TABLE SET STYLE *
TYPE=REPORT, GRID=OFF, $
TYPE=TITLE, STYLE=-UNDERLINE, $
TYPE=REPORT, COLUMN=CATEGORY, STYLE=UNDERLINE, $
ENDSTYLE
END
The partial report is: