Positioning Data in a Report

In this section:

You can position data within a report by selecting a justification (right, left or center) of a column or by specifying whether or not you wish to have data wrap within a cell. For information on positioning a column on the page, see Laying Out the Report Page.


Top of page

x
Controlling Wrapping of Report Data

How to:

Reference:

You can control the wrapping of report data in a report, thus preventing line breaks within report cells. When using HTML output, most web browsers will, by default, wrap alphanumeric report data that does not fit on a single line in a cell.

This bumps the contents of the cell onto a second line. A web browser wraps data based on its algorithmic settings. Use the WRAP attribute if you wish to suppress web browser data wrapping.

In PDF and PostScript report output, you can control the line spacing in wrapped lines by using the WRAPGAP attribute.

Wrapping Data in PDF Reports That Use the OVER Phrase

OVER allows the presentation of a single data record across multiple lines within a report. By default, when OVER is defined within a request, the report shifts from a columnar presentation to a row level presentation. The field titles are displayed to the left of each value rather than at the top of each column. This layout was not designed to be aligned in any specific fashion but to allow for the presentation of multiple elements of data within a small area. In many cases, reports that place columns over each other use blank AS names in order to align the columns properly. You can use the WRAP attribute to wrap data in PDF reports that use OVER and this technique works well with blank AS names.

Wrapping Data in PDF Reports That Use the ACROSS Phrase

In a request that uses ACROSS, the output displays each value of the ACROSS field above the set of data columns applicable to that ACROSS value.

If the ACROSS value is longer than the width of its columns, you can wrap the ACROSS value within the width of its underlying columns.

By default, the width of each ACROSS value group (the ACROSS value and the data columns within) is defined as the largest of either the sum of the width of the data columns or the largest ACROSS value for that group. With wrapping, the size of each ACROSS wrap will be defined by the width defined based on this rule including all data columns and any non-wrapped across fields.

The width of each ACROSS column for a given ACROSS group is defined as the length of the largest value for that ACROSS group. A single width is used for each group so in groups where the values are shorter than the longest value, you will see a larger right gap within the cell.

For reports containing multiple ACROSS fields, you can wrap individual ACROSS fields or all of them. Each designated value will wrap within the defined ACROSS group.


x
Syntax: How to Control Wrapping of Report Data

To control wrapping of text inside a report, use the following syntax within a StyleSheet.

TYPE=type, [subtype,] WRAP=value, $

where:

type
Is the report component you wish to affect, such as REPORT, HEADING, or TITLE.
subtype
Is any additional attribute, such as COLUMN, ACROSS, ITEM etc. that is needed to identify the report component that you are formatting. See Identifying a Report Component in a WebFOCUS StyleSheet for more information about how to specify different report components.
value
Is one of the following:

ON turns on data wrapping. ON is the default value for HTML report output. For PDF, PS, DHTML, and PPT report output, WRAP is set OFF by default. For these positioned formats in which the location of each item in the report is explicitly defined, WRAP = ON is not a valid value, but specific widths can be defined using the n option. For HTML reports, WRAP is supported with all fields. For PDF reports, WRAP is supported only with embedded fields, not text. Note: This setting is not supported when using WRAP with OVER in PDF report output.

OFF turns off data wrapping. This is the default value for PDF, PS, DHTML, and PPT report output.

n represents a specific numeric value that the column width can be set to. The value represents the measure specified with the UNITS parameter. This setting is supported for wrapping data in PDF reports that use the OVER phrase.

Note: WRAP=ON and WRAP=n are not supported with JUSTIFY.


Example: Allowing the Web Browser to Wrap Report Data

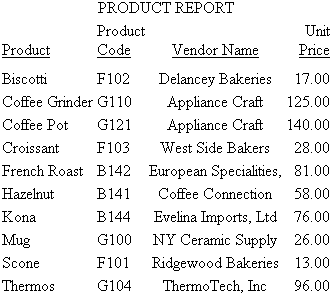
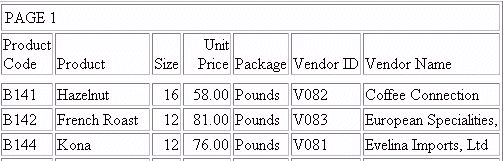
The following example, with WRAP=ON, wraps report data based on the Web browser functionality. Note that because this value is the default, there is no need to specify WRAP=ON in the report request syntax.

TABLE FILE GGPRODS
PRINT SIZE UNIT_PRICE PACKAGE_TYPE
VENDOR_CODE VENDOR_NAME
BY PRODUCT_ID BY PRODUCT_DESCRIPTION
ON TABLE SET STYLE *
TYPE=REPORT, GRID=ON, $
ENDSTYLE
END

Note: Wrap is determined by the size of your browser window, so you may need to shrink your window to see the example wrap the data as in the following image.

Notice that records in the Vendor Name column break to a second line.


Example: Suppressing the Wrapping of Report Data

The following report request, with WRAP=OFF, suppresses the Web browser data wrapping:

TABLE FILE GGPRODS
PRINT SIZE UNIT_PRICE PACKAGE_TYPE
VENDOR_CODE VENDOR_NAME
BY PRODUCT_ID BY PRODUCT_DESCRIPTION
ON TABLE SET STYLE * 
TYPE=REPORT, WRAP=OFF, $ 
TYPE=REPORT, GRID=ON, $
ENDSTYLE
END

The output is:


Example: Wrapping Columns With OVER

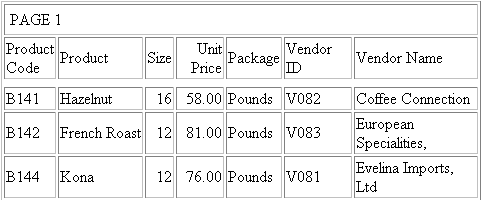
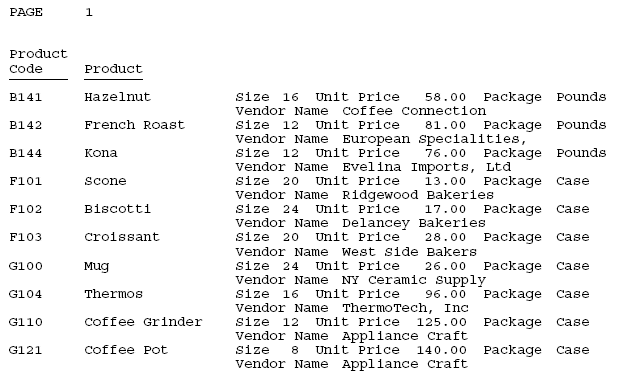
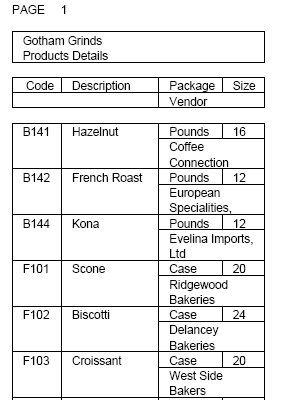
The following request against the GGPRODS data source places the column VENDOR_NAME on a new line with the OVER phrase. By default, wrap is turned off and must be defined explicitly within the StyleSheet:

TABLE FILE GGPRODS
PRINT SIZE UNIT_PRICE PACKAGE_TYPE OVER
VENDOR_NAME
BY PRODUCT_ID BY PRODUCT_DESCRIPTION
ON TABLE PCHOLD FORMAT PDF
END

The partial output is shown in the following image.

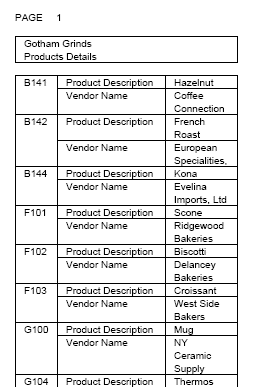
The following version of the request turns wrapping on and sets a column width of 1.5 for the VENDOR_NAME column, which has been placed on a new line because of the OVER phrase:

TABLE FILE GGPRODS
PRINT SIZE UNIT_PRICE PACKAGE_TYPE OVER
VENDOR_NAME
BY PRODUCT_ID BY PRODUCT_DESCRIPTION
ON TABLE PCHOLD FORMAT PDF
ON TABLE SET STYLE *
TYPE=REPORT, COLUMN=VENDOR_NAME, WRAP=1.5,$
ENDSTYLE
END

The partial output shows that the VENDOR_NAME column now wraps. Notice that turning WRAP ON causes the OVER value, not the OVER TITLE, to wrap:


x
Syntax: How to Wrap ACROSS Values

Wrapping ACROSS Values is supported for HTML and PDF output formats.

TYPE=ACROSSVALUE, [ACROSS={fieldname|Nn|An}] WRAP={OFF|ON} ,$

where:

ACROSS
If you have a request with multiple ACROSS fields, you can identify each field using the ACROSS identifier. You only need to include the ACROSS identifier if you have multiple ACROSS fields in your request.
fieldname
Specifies a horizontal sort row by its field name.
Nn
Identifies a column by its position in the report. To determine this value, count vertical sort (BY) fields, display fields, and ROW-TOTAL fields, from left to right, including NOPRINT fields.
An
Specifies a horizontal sort row by its position in the sequence of horizontal sort rows. To determine this value, count horizontal sort (ACROSS) fields. Cannot be combined with a field name specification in the same StyleSheet.
OFF
Turns off wrapping of the ACROSS values. OFF is the default value.
ON
Turns on wrapping of the ACROSS values.

Note: WRAP=ON is not supported with JUSTIFY.


Example: Wrapping ACROSS Values in PDF Report Output

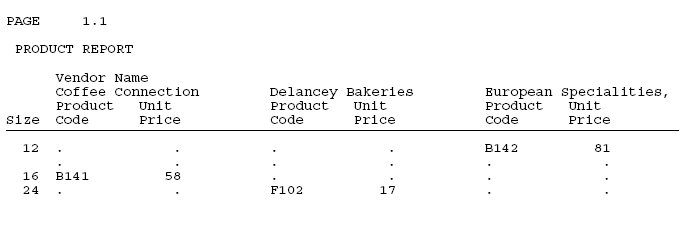
In the following request against the GGPRODS data source, VENDOR_NAME is an ACROSS field:

TABLE FILE GGPRODS
HEADING
" PRODUCT REPORT" 
" "
PRINT PRODUCT_ID UNIT_PRICE/D5
ACROSS VENDOR_NAME
BY SIZE
WHERE VENDOR_NAME GT 'B' AND VENDOR_NAME LT 'F'
ON TABLE PCHOLD FORMAT PDF
ON TABLE SET STYLE *
TYPE=REPORT, GRID=OFF, $
TYPE=REPORT, COLUMN=PRODUCT_ID, WIDTH=.25, $
TYPE=REPORT, COLUMN=UNIT_PRICE, WIDTH=.25, $
ENDSTYLE
END

As shown in the following image, the output is too wide for one panel because some of the ACROSS field values (vendor names) are longer than the sum of the product code and unit price columns under them.

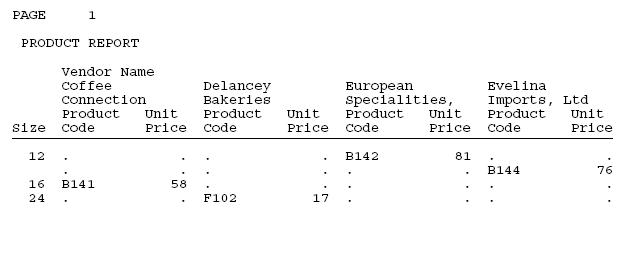
The following version of the request wraps the ACROSS values (TYPE=ACROSSVALUE, WRAP=ON ,$):

TABLE FILE GGPRODS
HEADING
" PRODUCT REPORT" 
" "
PRINT PRODUCT_ID UNIT_PRICE/D5
ACROSS VENDOR_NAME
BY SIZE
WHERE VENDOR_NAME GT 'B' AND VENDOR_NAME LT 'F'
ON TABLE PCHOLD FORMAT PDF
ON TABLE SET STYLE *
TYPE=REPORT, GRID=OFF, $
TYPE=REPORT, COLUMN=PRODUCT_ID, WIDTH=.25, $
TYPE=REPORT, COLUMN=UNIT_PRICE, WIDTH=.25, $
TYPE = ACROSSVALUE, WRAP=ON,$ 
ENDSTYLE
END

The report now fits on one panel, as shown in the following image.


x
Reference: OVER With Blank Column Titles

When OVER fields are defined with blank AS names (the value of the title of the column is set to empty ' '), they can be used to build a report with multiple data lines that present in an aligned grid fashion.

In this type of report, the column titles are usually indicated by adding multiple corresponding lines to the page headings rather than using the default titles that display to the left of the column field values. To present OVER fields with unique titles that take advantage of these new alignment features, you can place the column titles in independent fields and include them as fields within the given request.


Example: Using OVER and WRAP With Blank AS Names

The following example demonstrates using OVER with blank AS names and WRAP to build a multi-data line report:

TABLE FILE GGPRODS
PRINT PACKAGE_TYPE AS '' SIZE  AS '' OVER
VENDOR_NAME AS '' 
BY PRODUCT_ID  AS '' 
BY PRODUCT_DESCRIPTION  AS ''
ON TABLE SUBHEAD
"Gotham Grinds"
"Products Details"
HEADING 
" Code <+0>Description<+0>Size  <+0>Package"
-*" <+0> <+0>Vendor"
" <+0>Vendor"
ON TABLE PCHOLD FORMAT PDF
ON TABLE SET STYLE *
TYPE=REPORT, FONT=ARIAL, SIZE=10, SQUEEZE=ON,$
TYPE=REPORT, COLUMN=PACKAGE_TYPE, SQUEEZE=.5 ,$
TYPE=REPORT, COLUMN=VENDOR_NAME, WRAP=1 ,$
TYPE=REPORT, BORDER=ON, $
TYPE=HEADING, LINE=1, ITEM=1, BORDER=ON, $
TYPE=HEADING, LINE=1, ITEM=2, BORDER=ON, POSITION=PRODUCT_DESCRIPTION,$
TYPE=HEADING, LINE=1, ITEM=3, BORDER=ON, POSITION=SIZE ,$
TYPE=HEADING, LINE=1, ITEM=4, BORDER=ON, POSITION=PACKAGE_TYPE, $
TYPE=HEADING, LINE=2, ITEM=1, BORDER=ON, $
TYPE=HEADING, LINE=2, ITEM=2, BORDER=ON, POSITION=PACKAGE_TYPE,$
ENDSTYLE
END

On the report output, the Package Type and Size have been placed over the vendor name. The page heading has the corresponding titles. In the heading, the titles Package and Size have also been placed over the title Vendor Name. Note that the vendor name data wraps to maintain the alignment.


x
Reference: OVER and WRAP With Non-Blank Column Titles

The width of both the column title and the column data for each OVER value is determined by the single SQUEEZE or WRAP value. The title will automatically size to the same width as the wrapped data column. If the column title is wider than the width defined for the column wrap, you can either define a smaller title or add your titles as OVER fields that can be sized independently.

The following examples demonstrate how to build a report with OVER and WRAP that has column titles longer than the designated WRAP size.


Example: Using OVER and WRAP With Column Titles

The following request defines two virtual fields to contain the column titles for the Product Name and Vendor Name fields. It then prints each virtual field next to its related data field and gives each a blank AS name. The first virtual field and data field are placed over the second virtual field and data field:

DEFINE FILE GGPRODS
TITLE_PROD/A20 = 'Product Description';
TITLE_VEND/A20 = 'Vendor Name';
END
TABLE FILE GGPRODS
PRINT TITLE_PROD AS '' PRODUCT_DESCRIPTION  AS '' OVER
TITLE_VEND AS '' VENDOR_NAME  AS '' 
BY PRODUCT_ID  AS '' 
ON TABLE SUBHEAD
"Gotham Grinds"
"Products Details"
ON TABLE PCHOLD FORMAT PDF
ON TABLE SET STYLE *
TYPE=REPORT, FONT=ARIAL, SIZE=10, SQUEEZE=ON,$
TYPE=REPORT, COLUMN=TITLE_PROD , SQUEEZE=1.25 ,$
TYPE=REPORT, COLUMN=TITLE_VEND , SQUEEZE=1.25 ,$
TYPE=REPORT, COLUMN=PRODUCT_DESCRIPTION, WRAP=.75 ,$
TYPE=REPORT, COLUMN=VENDOR_NAME, WRAP=.75 ,$
TYPE=REPORT, BORDER=ON, $
ENDSTYLE
END

The output shows that the titles and data align properly.


x
Syntax: How to Control Spacing Between Wrapped Lines

You can use the WRAPGAP attribute in a StyleSheet to control spacing between wrapped lines in PDF and PostScript report output.

type=component, WRAPGAP={ON|OFF|n}

where:

component
Is the component with wrapped lines.
ON
Does not leave any space between wrapped lines. ON is equivalent to specifying 0.0 for n.
OFF
Places wrapped data on the next line. OFF is the default value.
n
Is a number greater than or equal to zero that specifies how much space to leave between wrapped lines (using the unit of measurement specified by the UNITS attribute). Setting n to zero does not leave any space between wrapped lines, and is equivalent to specifying WRAPGAP=ON.


Example: Specifying Spacing for Wrapped Lines

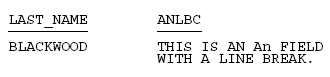
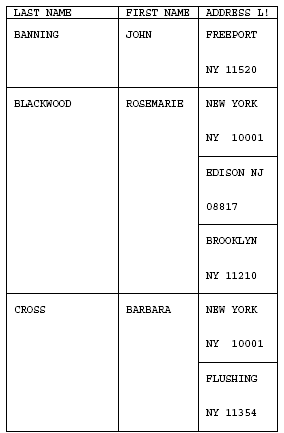
In the following request, wrapping is turned on for the ADDRESS_LN3 column of the report:

TABLE FILE EMPLOYEE                         
PRINT ADDRESS_LN3                           
BY LAST_NAME BY FIRST_NAME                  
WHERE LAST_NAME LE 'CROSS'                  
  ON TABLE PCHOLD FORMAT PDF    
ON TABLE SET PAGE NOPAGE                    
ON TABLE SET STYLE *                        
type=report, grid=on, $ 
type=data, topgap=0.2, bottomgap=0.2,  $    
type=data, wrapgap=off, $type=REPORT, column=ADDRESS_LN3, wrap=1.0 ,$
END

With WRAPGAP=OFF, each wrapped line is placed on the next report line:

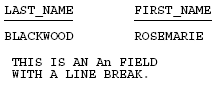
With WRAPGAP=ON, the wrapped lines are placed directly under each other:


x
Reference: Usage Notes for WRAPGAP

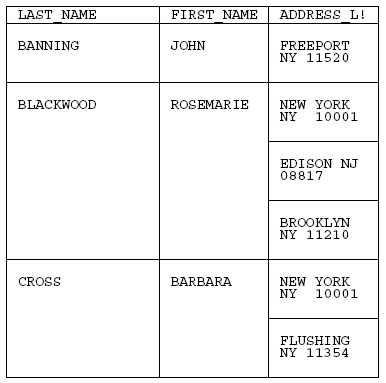
You can only specify WRAPGAP for columns that have wrapping enabled (WRAP attribute or parameter set to ON or a number). The TOPGAP and BOTTOMGAP attributes specify how much vertical space to leave above and below a report component. Increasing the values or these attributes makes a decrease in spacing between wrapped lines more noticeable.


Top of page

x
Controlling Wrapping With Alternative Methods

How to:

Reference:

In addition to the WRAP parameter, whether or not text wraps within a cell is affected by the SQUEEZE and GRID attributes. Both SQUEEZE and GRID can be used as SET commands or StyleSheet attributes. By specifying a setting other than the default value for these two attributes, the wrapping behavior in a browser is affected.


x
Reference: Set Commands That Affect Wrapping in a Report

The following SET commands affect the wrapping of data.

Command

Action

SET SQUEEZE=OFF

Forces the browser to display the entire column width and suppresses the wrapping of column data.

SET SQUEEZE=ON

Allows the browser to follow its own display behavior. If a browser settings are specified, columns will be compressed to the length of the longest data value, and column data with embedded blanks will be wrapped.

SET GRID=OFF

Automatically suppresses the wrapping of data.

SET GRID=ON

Has no effect on either wrapping or compressing column width.


x
Syntax: How to Control Wrapping Using SQUEEZE

SQUEEZE can be used as either a SET parameter or a StyleSheet attribute. To control wrapping using SQUEEZE, use the following syntax within a StyleSheet.

TYPE =type, SQUEEZE=value, $

where:

type
Is the report component you wish to affect, such as REPORT, HEADING, or TITLE.
value
Is one of the following:

ON turns on data wrapping.

OFF turns off data wrapping. This is the default value.

n represents a specific numeric value to which the column width can be set (valid only in PDF and PostScript). The value represents the measure specified with the UNITS parameter.


x
Syntax: How to Control Wrapping Using SQUEEZE as a SET Command

To suppress the wrapping feature in a report by setting the SQUEEZE attribute to OFF, use the following syntax.

SET SQUEEZE=value, $

where:

value
Is one of the following:

ON turns on data wrapping.

OFF turns off data wrapping. OFF is the default value.

n represents a specific numeric value to which the column width can be set (valid only in PDF and PS). The value represents the measure specified with the UNITS parameter.

Note: For PDF reports, if a data value is wider than the specified width of the column, it will be hidden from view. For Excel reports, column width can be adjusted after the spreadsheet has been generated.


x
Reference: Usage Notes for WRAP and SQUEEZE

Top of page

x
Justifying Report Columns

How to:

You can adjust text within a column by specifying whether report columns are left justified, right justified, or centered. By default, alphanumeric columns are left justified, numeric columns are right justified, and heading and footing elements are left justified. However, you can change the default using the JUSTIFY attribute. For information on justifying column titles using /R /L and /C, see Using Headings, Footings, Titles, and Labels.


x
Syntax: How to Justify a Report Column

To left justify, right justify, or center a column, use the following syntax within a StyleSheet.

TYPE=type, [subtype,] [COLUMN=column,] JUSTIFY=option, $

where:

type
Is the report component you wish to affect, such as REPORT, HEADING, or TITLE.
subtype
Is any additional attribute, such as COLUMN, ACROSS, ITEM, that is needed to identify the report component that you are formatting. See Identifying a Report Component in a WebFOCUS StyleSheet for more information on how to specify different report components.
column
Is the column or group of columns you wish to justify. This attribute is only necessary if you wish to justify a specific column or set of columns. Omitting this attribute justifies the entire report.
option
Is the justification you wish to select:

LEFT specifies that the column will be left justified.

RIGHT specifies that the column will be right justified.

CENTER specifies that the column will be centered.

Note: JUSTIFY is not supported with WRAP=ON or WRAP=n.


Example: Justifying Data in a Report Column

The following example displays the StyleSheet syntax used to center the data in the Vendor Name column. The header is also center justified.

TABLE FILE GGPRODS
HEADING
"PRODUCT REPORT"
SUM UNITS BY PRODUCT_DESCRIPTION BY PRODUCT_ID BY VENDOR_NAME
ON TABLE SET STYLE * 
TYPE=REPORT, COLUMN=VENDOR_NAME, JUSTIFY=CENTER,  $
TYPE=HEADING, JUSTIFY=CENTER, $ 
TYPE=REPORT, GRID=OFF, $
ENDSTYLE
END

The output is:


Top of page

x
Field-Based Reformatting

How to:

Field-based reformatting allows you to apply different formats to each row in a single report column by using a field to identify the format that applies to each row. For example, you can use this technique to apply the appropriate decimal currency formats when each row represents a different country.

The field that contains the format specifications can be:

The field that contains the formats must be alphanumeric and be at least eight characters in length. Only the first eight characters are used for formatting.

The field-based format may specify a length longer than the length of the original field. However, if the new length is more than one-third larger than the original length, the report column width may not be large enough to hold the value (indicated by asterisks in the field).

You can apply a field-based format to any type of field. However, the new format must be compatible with the original format:

If the field-based format is invalid or specifies an impermissible type conversion, the field displays with plus signs (++++) on the report output. If the format field is blank or missing, the value is displayed without reformatting.


x
Syntax: How to Define and Apply a Format Field

After the format field is defined, you can apply it in a report request:

TABLE FILE filename
displayfieldname/format_field[/just]
END

where:

display
Is any valid display command.
fieldname
Is a field in the request to be reformatted.
format_field
Is the name of the field that contains the formats. If the name of the format field is the same as an explicit format, the explicit format will be used. For example, a field named I8 cannot be used for field-based reformatting because it will be interpreted as the explicit format I8.
just
Is a justification option, L, R, or C. The justification option can be placed before or after the format field, separated from the format by a slash.


Example: Displaying Different Decimal Places for Currency Values
DEFINE FILE CAR
CFORMAT/A8 = DECODE COUNTRY('ENGLAND' 'D10.1' 'JAPAN' 'D10' ELSE 
'D10.2');
END
 
TABLE FILE CAR
SUM SALES/CFORMAT/C DEALER_COST/CFORMAT
BY COUNTRY
END

The output is:

COUNTRY       SALES    DEALER_COST
-------     ---------  -----------
ENGLAND      12,000.0     37,853.0
FRANCE            .00     4,631.00
ITALY       30,200.00    41,235.00
JAPAN          78,030        5,512
W GERMANY   88,190.00    54,563.00

Top of page

x
Data Visualization

How to:

Reference:

To make HTML reports more powerful, you can insert visual representations of selected data directly into the report output. These visual representations are in the form of vertical or horizontal bar graphs that make relationships and trends among data more obvious. For details see Displaying Report Data.


x
Reference: Formatting Options for Data Visualization Bar Graphs

You can specify optional formatting attributes for data visualization bar graphs in the GRAPHTYPE declaration. The following table lists the formatting attributes and a description of each:

Formatting Attribute

Description

GRAPHCOLOR

Sets the color of the bar graphs.

GRAPHLENGTH

Sets the length of the longest bar graph. The value for GRAPHLENGTH determines the length in measurement units (inches, centimeters, and so on) of the longest bar graph in a vertical or horizontal bar graph.

The length value is expressed in the current units, which is set using the UNITS StyleSheet attribute. The GRAPHLENGTH value is then converted into pixels.

GRAPHWIDTH

Sets the width of the bar graphs. The width value is expressed in the current units. See GRAPHLENGTH, above, for more information about units.

Note: Graphcolor=orange is not supported.


x
Syntax: How to Incorporate Data Visualization Formatting Attributes
GRAPHTYPE=DATA, {COLUMN|ACROSSCOLUMN|FIELD}=identifier,
 [GRAPHCOLOR=graphcolor,] [GRAPHLENGTH=lengthvalue,]
 [GRAPHWIDTH=widthvalue,] $

where:

GRAPHCOLOR
Specifies the color of the bar graphs. Black is the default color if you omit this attribute from the declaration.
graphcolor

Is one of the following values:

AQUA
BLACK
BLUE
FUCHSIA
GRAY
GREEN
LIME
MAROON
NAVY
OLIVE
PURPLE
RED
SILVER
TEAL
WHITE
YELLOW
GRAPHLENGTH
Specifies the length of the longest bar graph. The default length is 60 pixels for a vertical bar graph and 80 pixels for a horizontal bar graph.
lengthvalue
Sets the value used to display the vertical or horizontal bar graph for the maximum data value in the associated report column. This value must be a positive number.

This value is initially expressed in the current units (using the UNITS attribute). This value is then converted into the corresponding number of pixels.

GRAPHWIDTH
Specifies the width of the bar graphs in a report.
widthvalue
Sets the value used to display the width of the bar graphs in a report. This value must be a positive number.

This value is initially expressed in the current units (defined by the UNITS attribute). This value is then converted into the corresponding number of pixels.


x
Displaying Multi-Line An and AnV Fields

How to:

Using StyleSheet attributes, you can display An (character) and AnV (varchar) fields that contain line breaks on multiple lines in a PDF or PostScript report. Line breaks can be based on line-feeds, carriage-returns, or a combination of both. If you do not add these StyleSheet attributes, all line-feed and carriage-return formatting within these fields will be ignored, and all characters will be displayed on one line that wraps to fit the width of the report.


x
Syntax: How to Display An and AnV Fields Containing Line Breaks on Multiple Lines
TYPE=REPORT,LINEBREAK='type',$

where:

REPORT
Is the type of report component. TYPE must be REPORT. Otherwise an error will result.
'type'
Specifies that line breaks will be inserted in a report based on the following:

LF inserts a line break after each line-feed character found in all An and AnV fields.

CR inserts a line break after each carriage-return character found in all An and AnV fields.

LFCR inserts a line break after each combination of a line-feed character followed by a carriage-return character found in all An and AnV fields.

CRLF inserts a line break after each combination of a carriage-return character followed by a line-feed character found in all An and AnV fields.

Note: The report output must be formatted as PDF or PostScript.


Example: Displaying an Alphanumeric Field With Line Breaks in a PDF Report

The following request defines an alphanumeric named ANLB field with a semicolon (in an EDCDIC environment) or a circumflex (in an ASCII environment) in the middle. The CTRAN function then replaces the semicolon or circumflex with a carriage return character and stores this string in a field named ANLBC. On the report output, this field displays on two lines:

DEFINE FILE EMPLOYEE                                
ANLB/A40 ='THIS IS AN An FIELD;WITH A LINE BREAK.'; 
ANLBC/A40 = CTRAN(40, ANLB, 094, 013  , ANLBC);     
END                                                 
TABLE FILE EMPLOYEE                                 
PRINT LAST_NAME ANLBC                                        
WHERE LAST_NAME EQ 'BLACKWOOD' 
ON TABLE HOLD FORMAT PDF                
ON TABLE SET STYLE *                               
TYPE=REPORT,LINEBREAK='CR',$                        
ENDSTYLE                                           
END

The output is:


Example: Using an Alphanumeric Field With a Line Break in a Subfoot

The following request defines an alphanumeric named ANLB field with a semicolon in the middle. The CTRAN function then replaces the semicolon (in an EDCDIC environment) or a circumflex (in an ASCII environment) with a carriage return character and stores this string in a field named ANLBC. In the subfoot, this field displays on two lines:

DEFINE FILE EMPLOYEE                                
ANLB/A40 ='THIS IS AN An FIELD;WITH A LINE BREAK.'; 
ANLBC/A40 = CTRAN(40, ANLB, 094, 013  , ANLBC);     
END                                                 
TABLE FILE EMPLOYEE                                 
PRINT FIRST_NAME                                    
BY LAST_NAME                                        
WHERE LAST_NAME EQ 'BLACKWOOD'                      
ON LAST_NAME SUBFOOT                                
  " "                                               
  " <ANLBC "                                        
ON TABLE HOLD FORMAT PDF                 
ON TABLE SET STYLE *                                
TYPE=REPORT,LINEBREAK='CR',$                        
ENDSTYLE                                            
END                                                 

The output is:


WebFOCUS