How to: |
You can use a check box control to display a list of column names from a source report. At run time, end users can check the name of each column that they want to show in a target report or chart on an active dashboard, and uncheck the name of each column that they want to hide. All target reports and charts that contain columns from the list are updated with the choice of columns as end users check and uncheck names.
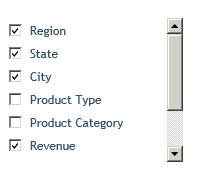
The following is a list of column names in a sample check box control.
When you run an active dashboard for the first time, a NOPRINT or hidden column in a report or chart component on the dashboard is not displayed in the report or chart output. If that report or chart component is the source report for a check box control, the NOPRINT or hidden column is unchecked (deselected) in the corresponding check box by default.
A check box for all other columns in the source report is initially checked (selected) by default.
The list of column names in a check box control uses the field name or title specified in the Master File for the data source. If the source report uses an AS phrase to specify the column title, that title is used in the list.
This feature applies to an active dashboard with output format AHTML. It does not support the use of ACROSS column names.
COMPOUND LAYOUT PCHOLD FORMAT AHTML
.
.
.
OBJECT=CHECKBOX,. . .
ARDATA_REPORT='name_of_source_report',
ARDATA_COLUMN='{@@COLUMNS|@@BYS|@@MEASURES}',
ARFILTER_TARGET=’target_report_name1,target_report_name2,...',
.
.
.
where:
Indicates the supported output format for an active dashboard. The use of a check box control to show or hide columns in a report is available for a compound layout report with output format AHTML.
Adds a check box control to an active dashboard.
Is the name of the source report that contains the column names that populate the check box control on an active dashboard.
This property is required for the check box control as described in this feature.
Indicates which set of column names is included in the check box control on an active dashboard. The available options are:
This property is required for the check box control as described in this feature.
Is the name of the target report or chart that is updated by the choice of column names made in the check box control. You can update multiple reports and charts with the end user choices. To update multiple components, provide a list of component names, separating each name with a comma (,).
This property is required for the check box control as described in this feature.
For details on OBJECT syntax, see the information on configuring active form controls with WebFOCUS syntax in the Active Technologies User's Guide.
The following sample code creates three check box controls, each with a set of column names used to show or hide columns in a report and chart on an active dashboard.
All three types of check box controls are shown for the purpose of illustration. In a real application, you would typically include the first set only (all columns in the source report), the second set only (all BY columns in the source report), the third set only (all measure columns in the source report), or any combination of these sets.
COMPOUND LAYOUT PCHOLD FORMAT AHTML
UNITS=IN,SHOW_GLOBALFILTER=OFF, $
SECTION=section1, LAYOUT=ON, ORIENTATION=PORTRAIT, PAGESIZE=Letter, $
PAGELAYOUT=1, NAME='Page layout 1', text='Page layout 1', $
COMPONENT='report1', TEXT='report1', POSITION=(0.5 3),
   DIMENSION=(12 2), $
COMPONENT='graph1', TEXT='graph1', POSITION=(0.5 7.5),
   DIMENSION=(12 6), $
OBJECT=CHECKBOX, NAME='object1',COLOR=RGB(53 78 109), FONT='ARIAL',
   ARFILTER_TARGET='report1,graph1', ARDATA_COLUMN='@@COLUMNS',
   ARDATA_REPORT='report1', POSITION=(.5 .5), DIMENSION=(2.5 2), $
OBJECT=CHECKBOX, NAME='object2',COLOR=RGB(53 78 109), FONT='ARIAL',
   ARFILTER_TARGET='report1,graph1', ARDATA_COLUMN='@@BYS',
   ARDATA_REPORT='report1', POSITION=(4.5 .5), DIMENSION=(2 2), $
OBJECT=CHECKBOX, NAME='object3',COLOR=RGB(53 78 109), FONT='ARIAL',
   ARFILTER_TARGET='report1,graph1', ARDATA_COLUMN='@@MEASURES',
   ARDATA_REPORT='report1', POSITION=(7.5 .5), DIMENSION=(2 2), $
END
SET COMPONENT='report1'
TABLE FILE CENTURYSALES
SUM LINEPRICE AS 'Revenue'
PROFIT NOPRINT
COSTOFGOODSSOLD
QUANTITY NOPRINT
BY REGION
BY STATE
BY CITY
BY PRODUCTTYPE
BY PRODUCTCATEGORY
WHERE CENTURYSALES.ORDERS.YEAR EQ '2006';
WHERE CENTURYSALES.STORESEG.COUNTRY EQ 'United States';
WHERE CENTURYSALES.STORESEG.REGION EQ 'Middle Atlantic' OR
   'Pacific' OR 'South Atlantic' OR 'New England' OR
   'East North Central' OR 'West South Central';
WHERE CENTURYSALES.PRODSEG.PRODUCTCATEGORY EQ 'Audio Systems'
   OR 'DVD' OR 'DVD Camcorders' OR 'Digital Cameras' OR
   'Organizers' OR 'TV';
WHERE RECORDLIMIT EQ 200;
ON TABLE SET ARGRAPHENGINE JSCHART
ON TABLE PCHOLD FORMAT AHTML
ON TABLE SET STYLE *
INCLUDE = ENInformationBuilders_Medium1, $
TYPE=REPORT, LINES-PER-PAGE=10, $
TYPE=REPORT, COLUMN=N4, HIDE=ON, $
TYPE=REPORT, COLUMN=N5, HIDE=ON, $
ENDSTYLE
END
SET COMPONENT='graph1'
GRAPH FILE CENTURYSALES
SUM LINEPRICE AS 'Revenue'
PROFIT NOPRINT
COSTOFGOODSSOLD
QUANTITY NOPRINT
BY REGION NOPRINT
BY STATE NOPRINT
BY CITY
BY PRODUCTTYPE
BY PRODUCTCATEGORY
WHERE CENTURYSALES.ORDERS.YEAR EQ '2006';
WHERE CENTURYSALES.STORESEG.COUNTRY EQ 'United States';
WHERE CENTURYSALES.STORESEG.REGION EQ 'Middle Atlantic' OR
   'Pacific' OR 'South Atlantic' OR 'New England' OR
   'East North Central' OR 'West South Central';
WHERE CENTURYSALES.PRODSEG.PRODUCTCATEGORY EQ 'Audio Systems'
   OR 'DVD' OR 'DVD Camcorders' OR 'Digital Cameras' OR
   'Organizers' OR 'TV';
WHERE RECORDLIMIT EQ 200;
ON GRAPH SET ARGRAPHENGINE JSCHART
ON GRAPH PCHOLD FORMAT AHTML
ON GRAPH SET LOOKGRAPH VLINE
ON TABLE SET STYLE *
INCLUDE = ENInformationBuilders_Medium1, $
TYPE=REPORT, LINES-PER-PAGE=20, $
TYPE=REPORT, COLUMN=N4, HIDE=ON, $
TYPE=REPORT, COLUMN=N5, HIDE=ON, $
ENDSTYLE
END
COMPOUND END
When you run the compound layout report, the following output is displayed.
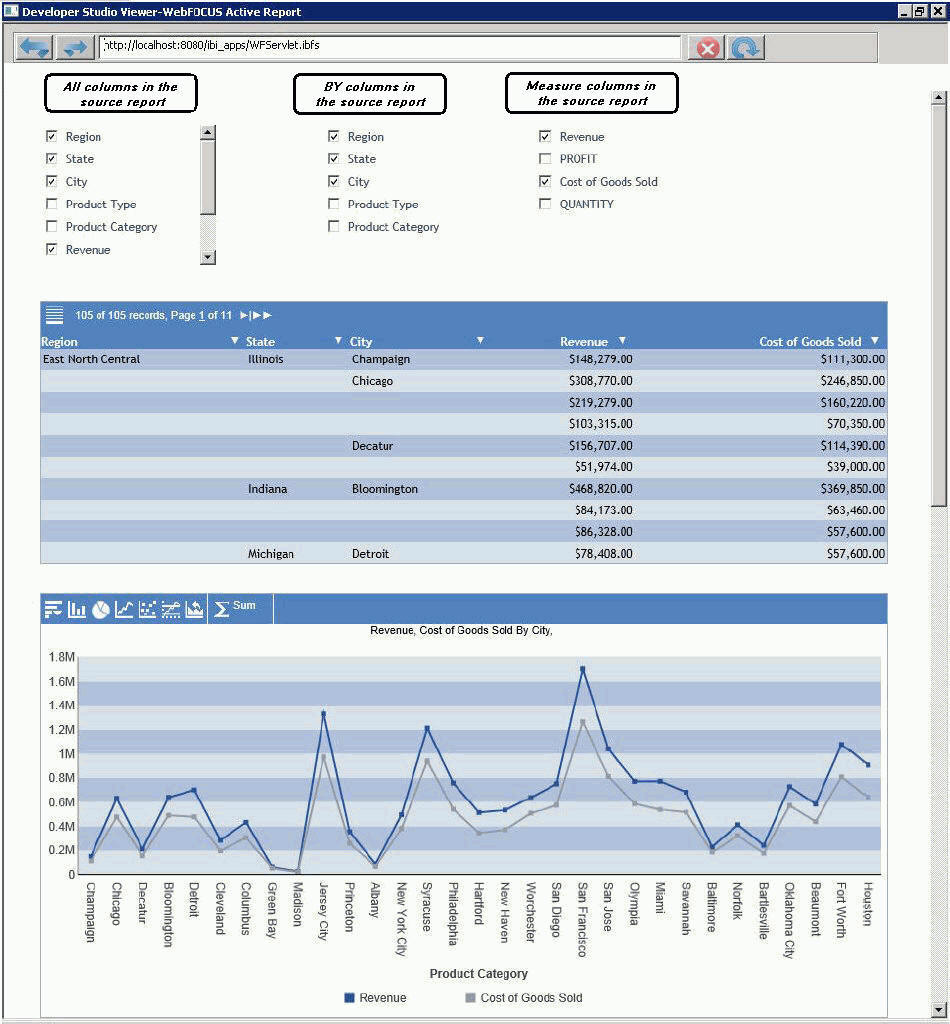
On the sample active dashboard:
The first set of column names is created by the following property:
ARDATA_COLUMN='@@COLUMNS'
The name of the source report that contains the column names that populate the check box control is report1:
ARDATA_REPORT='report1'
There is a check box for every column in the source report named report1.
The second set of column names is created by the following property:
ARDATA_COLUMN='@@BYS'
The name of the source report that contains the column names that populate the check box control is report1.
There is a check box for every BY column in the source report named report1.
The third set of column names is created by the following property:
ARDATA_COLUMN='@@MEASURES'
The name of the source report that contains the column names that populate the check box control is report1.
There is a check box for every measure column in the source report named report1.
Notice that a check box in the first and third set of column names displays the column title Revenue, as specified by the AS phrase in the source report (SUM LINEPRICE AS 'Revenue').
The check boxes for Product Type, Product Category, PROFIT, and QUANTITY are initially deselected because these columns are hidden in the source report.
Note: Product Type and Product Category are hidden using the HIDE=ON WebFOCUS StyleSheet setting to preserve the column titles specified in the Master File, whereas PROFIT and QUANTITY are NOPRINT columns in the source report, resulting in the display of the actual field names.
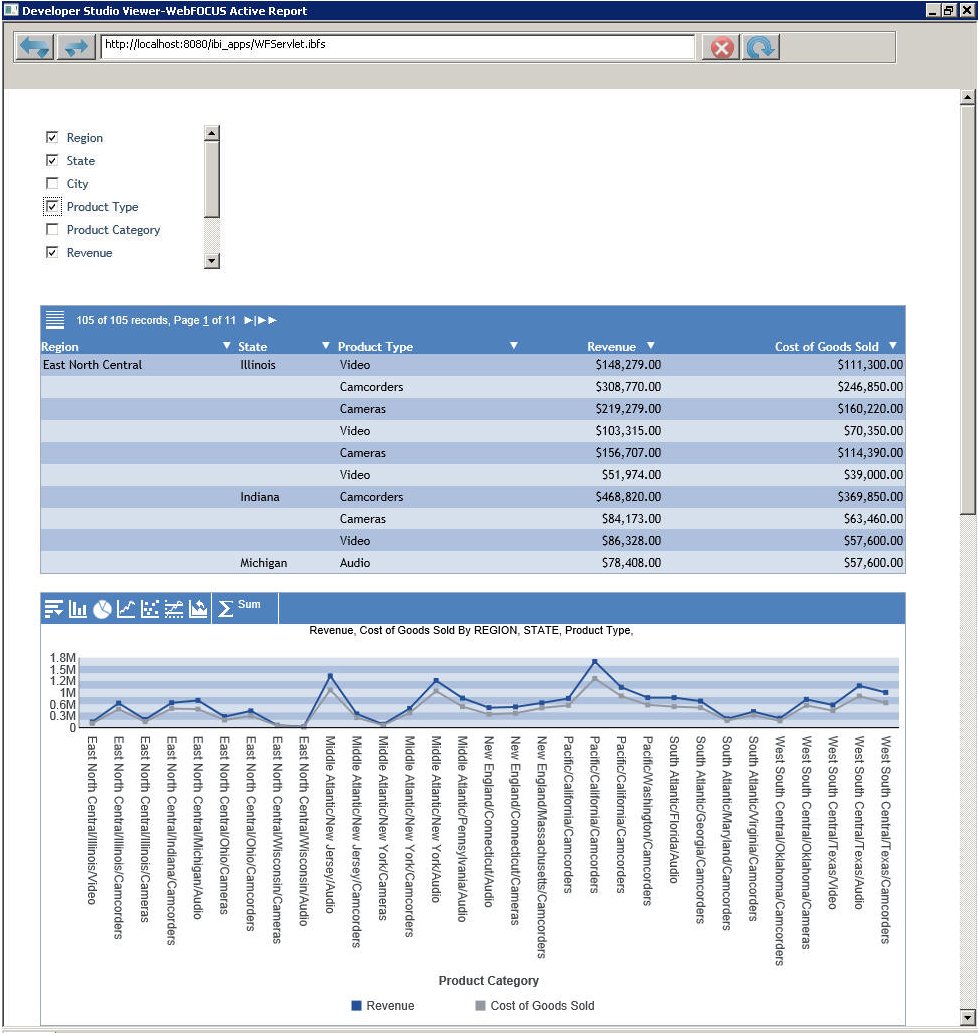
You can now make a choice of columns to display in the target report and chart specified in the following property:
ARFILTER_TARGET='report1,graph1'
For example, to hide the column City in the target report and chart, deselect the check box for City in the full set of column names. The column City is removed from the report and chart on the active dashboard.
To show the column Product Type in the target report and chart, select the check box for Product Type in the full set of column names. The column Product Type is now shown in the report and chart on the active dashboard.
The updated report and chart reflecting your choices are shown in the following image.
| WebFOCUS |