The following syntax shows the PAGELAYOUT definition for DASHBOARDBAR in a section in a compound layout report. It includes a required report component, which in turn can be followed by other components and objects.
For details on the syntax used in Document Composer to create a compound layout report, see the Creating Reports With WebFOCUS Language manual.
Use the following syntax
COMPOUND LAYOUT PCHOLD FORMAT output_format
SECTION=section_name, LAYOUT=ON, MERGE={AUTO|OFF},
   ARGRAPHENGINE=chart_engine...,$
PAGELAYOUT=DASHBOARDBAR,$
COMPONENT=component_name, TYPE=REPORT, POSITION=(x y),
   HIDDEN={ON|OFF}...,$
.
.
.
END
COMPOUND END
where:
- output_format
-
Is AHTML, FLEX, or APDF.
- section_name
-
Is a unique identifier for the section. It can be up to 16 characters long.
- LAYOUT=ON
-
Specifies that the section uses a complex layout. LAYOUT=ON is the only available option at this time.
- MERGE={AUTO|OFF}
-
Enables you to choose one of two options supported by the Active Technologies output formats. The default value is OFF. For more information on the use of this attribute, see the Active Technologies User's Guide.
- chart_engine
-
Is any chart engine, for example, JSCHART.
- PAGELAYOUT=DASHBOARDBAR
-
Must be DASHBOARDBAR.
- component_name
-
Is a unique identifier for the report component that is required inside the page layout. It is the name of a report that appears later in the request. The component name can be up to 16 characters long.
- TYPE=REPORT
-
Is the type of component. REPORT is the only supported value.
- x y
-
Is the (x y) coordinate on the page where the upper-left corner of the component is placed. All coordinates are in current UNITs (the default value is inches), and (0 0) is the upper-left corner of the physical page.
- HIDDEN={ON|OFF}
-
Either hides the active report component on the active dashboard (ON), or displays the active report component on the active dashboard (OFF). The default value is OFF.
Note: In the preceding syntax, ellipses (...) indicate that you can include other valid attributes.
The following code creates a heading area for an active dashboard.
COMPOUND LAYOUT PCHOLD FORMAT AHTML
SECTION=S1, LAYOUT=ON, MERGE=OFF, ARGRAPHENGINE=JSCHART,
   ARSTYLESET=bipsilver, ARICONSET=WHITE,$
PAGELAYOUT=DASHBOARDBAR,$
COMPONENT=R0, TYPE=REPORT, POSITION=(3 1), DIMENSION=(3 2),$
COMPONENT=G0, TYPE=REPORT, POSITION=(7 1), DIMENSION=(4 3),$
OBJECT=STRING, NAME=Text_1, POSITION=(0.2 0.2), TEXT='Regional Sales',
   FONT='ARIAL', SIZE=20, COLOR=RGB(0 72 132), WRAP=OFF,
   DIMENSION=(4.270833 0.71875),$
OBJECT=COMBOBOX, NAME='object6', COLOR='blue', SIZE=12, FONT=ARIAL,
   ARFILTER_SHOWALL=OFF, ARFILTER_TARGET='R1,R2,G0',
   ARDATA_COLUMN=REGION, ARDATA_REPORT=R0, ARFILTER_CONDITION=EQ,
   POSITION=(0.2 1), DIMENSION=(2 .5), ARFILTER_ACTIVE=ONLOAD,$
PAGELAYOUT=1, TEXT=layout 1, BACKCOLOR=RGB(0 72 132),$
COMPONENT=R1, TYPE=REPORT, POSITION=(.5 .5), DIMENSION=(4.2 4),$
PAGELAYOUT=2, TEXT=layout 2, BACKCOLOR='aqua',$
COMPONENT=R2, TYPE=REPORT, POSITION=(.5 .5), DIMENSION=(6.3 4),$
END
SET COMPONENT=R0
TABLE FILE GGSALES
SUM DOLLARS
BY REGION
ON TABLE SET STYLE *
INCLUDE = ENInformationBuilders_Medium1,$
ENDSTYLE
END
SET COMPONENT=G0
GRAPH FILE GGSALES
SUM DOLLARS
BY REGION
BY CATEGORY
ON GRAPH SET LOOKGRAPH PIE
ON GRAPH PCHOLD FORMAT AHTML
ON TABLE SET STYLE *
INCLUDE = ENInformationBuilders_Medium1,$
TYPE=REPORT,
     COLUMN=N1,
     HIDE=ON,
$
ENDSTYLE
END
SET COMPONENT=R1
TABLE FILE GGSALES
SUM UNITS BUDUNITS
BY REGION
BY ST
BY CATEGORY
BY PRODUCT
ON TABLE SET STYLE *
INCLUDE = ENInformationBuilders_Medium1,$
TYPE=REPORT,
     LINES-PER-PAGE=10,
$
ENDSTYLE
END
SET COMPONENT=R2
TABLE FILE GGSALES
SUM BUDDOLLARS DOLLARS
BY REGION
BY CATEGORY
BY PRODUCT
ON TABLE SET STYLE *
INCLUDE = ENInformationBuilders_Medium1,$
ENDSTYLE
END
COMPOUND END
When you run the compound layout report, the output that is generated is shown in the images that follow.
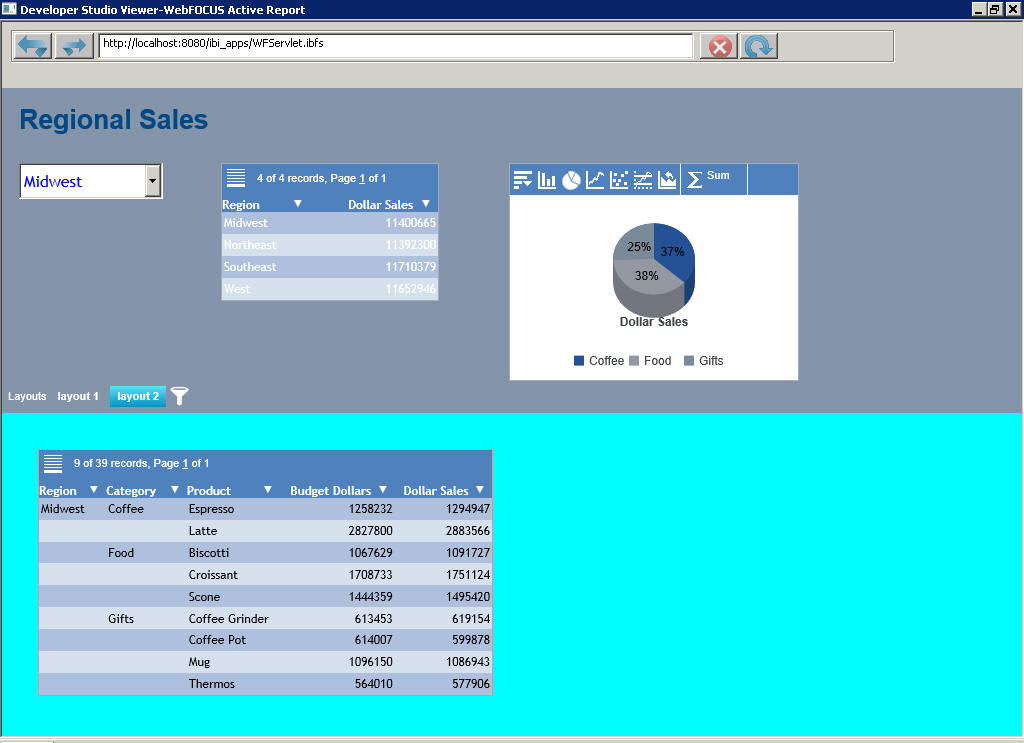
The heading area for the active dashboard is at the top of the window. A tabular active report on the dashboard is in the lower half of the window, on a navy background.
The heading area for the active dashboard contains an active chart, a tabular active report, and a drop-down list for filtering the data on the dashboard.
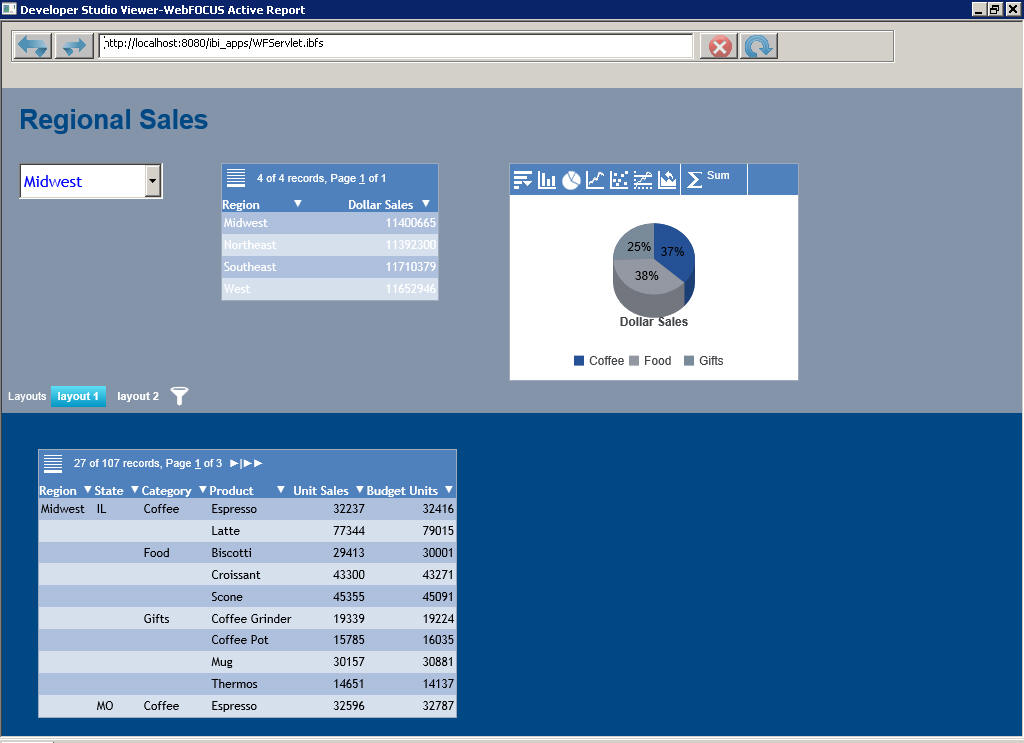
The filter from the drop-down list is applied to the components associated with this active form control, namely, the active chart at the top and the tabular active report in the lower half of the window.
The heading area for the active dashboard remains above all the tabs on the dashboard. As shown in the following image, the filter from the drop-down list in the heading area is also applied to the tabular active report on the second tab of the dashboard to broaden the scope of data analysis.