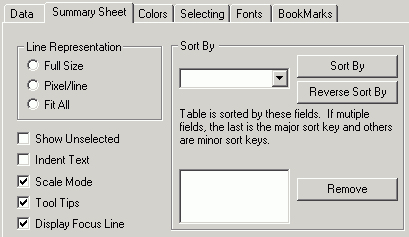
- Line Representation
-
- Full Size
-
Shows text in a normal, readable size.
- Pixel/line
-
Draws text as one-pixel-high lines. This is helpful when you need to reduce the size of the text to see more of the data. Depending on how many lines you have in your table, this may still require paging to see all rows.
- Fit All
-
Shows the entire table in the current window. If there are fewer table rows than will fit in the window at full size, then the lines are shown in a larger font with more spacing. If there are more lines than will fit (the more common case), then they are reduced to a smaller size, with a minimum height of 1 pixel. If all table rows will still not fit at 1 pixel high, then lines are overplotted to allow all to fit. When values are overplotted, the line that is longest or with the hottest color is drawn on the top, obscuring all others under it.
- Show Unselected
-
Shows unselected data in gray. If Show Unselected is not checked, unselected data is omitted from the display.
To add unselected data, either turn on Show Unselected in the Properties dialog box, or use the right mouse button menu in the view and choose Select All.
- Indent Text
-
Indents text fields if the text has leading white space. When this option is not selected the leading white space is ignored in text fields, so that all fields start against the left column border.
- Scale Mode
-
Shows the reduced line representation option. When this option is not selected, the display is locked into text mode.
- Tool Tips
-
Displays the entire string of a truncated line when the cursor is placed in the column.
- Display Focus Line
-
Displays the name of each selected (in focus) field.
- Sort By
-
Sorts the glyphs by the specified field.
- Reverse Sort By
-
Reverses the sort order.
- Remove
-
Removes the highlighted field from the sort.