In this section: |
A count provides a statistical summary of a data table, and lists exact numerical values for data fields within the table, in an easy-to-read, textual format. Counts should be used when specific information (for example, mean, standard deviation, minimum, maximum, or most common value) is needed for either an entire table or a selected subset of that table.

Counts that are created using WebFOCUS Visual Discovery can also include:
Reference: |
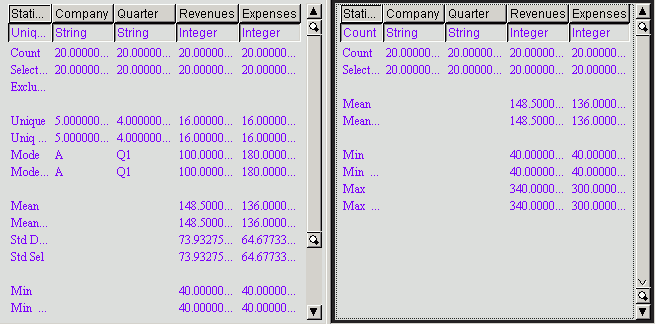
A count displays data in these formats:
The counts component is typically used with other data visualization components.
Note: You can only see summary statistics in counts. You cannot select items in this component. When selections are made in other components, however, counts is updated.
|
Label |
Meaning... |
|---|---|
|
Count |
The total number of all items. |
|
Deleted |
The total number of excluded items. |
|
Max |
The largest value of any items. |
|
Max Sel |
The largest value of any of the selected items. |
|
Mean |
The mean of all items. |
|
Mean Sel |
The mean of the selected items. |
|
Min |
The smallest value of any item. |
|
Min Sel |
The smallest value of any selected item. |
|
Mode |
The value with the most items. |
|
Mode Sel |
The value with the most selected items. |
|
Selected |
The total number of selected items. |
|
Sum Sel |
The sum of all of the selected items. |
|
Std Dev |
The standard deviation for all items. |
|
Std Sel |
The standard deviation for selected items. |
|
Sum |
The sum of all items. |
|
Unique |
The number of unique values. |
|
Uniq Sel |
The number of unique values for selected items. |

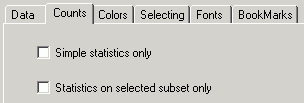
Presents a subset of the statistics.
Presents statistics about the selected item(s).
The pop-up menu appears when you right-click a Visual Discovery component in the analytical dashboard. These options do not appear when you are developing a component in the HTML Composer.
Shows unselected data in gray. If Show Unselected is not checked, unselected data is omitted from the display.
To add unselected data, either turn on Show Unselected in the Properties dialog box, or use the right mouse button menu in the view and choose Select All.
Shows text fields indented if the text has leading white space. When this option is not selected the leading white space is ignored in text fields, so that all fields start against the left column border.
Presents a subset of the statistics.
Presents statistics about the selected item(s).
Restores the graph to the initial sort order.
Enables you to search for a specific value.
Exports the data to a file of the type you specify, for example, Microsoft Excel.
Shows text in a normal, readable size.
Shows the entire table in the current window. If there are fewer table rows than will fit in the window at full size, then the lines are shown in a larger font with more spacing. If there are more lines than will fit, then they are reduced to a smaller size, with a minimum of 1 pixel high. If all table rows will still not fit at 1 pixel high, then lines are overplotted to allow all to fit. When values are overplotted, the line that is longest or with the hottest color is drawn on the top, obscuring all others under it.
Pixel/line representation draws text as one-pixel-high lines. This is helpful when you need to reduce the size of the text to see more of the data. Depending on how many lines you have in your table, this may still require paging to see all rows.
Zooms the data sheet so it contains all the rows of data, some of which may be overplotted to fit.
Reverses the previous action. You may repeatedly undo actions retained in the history file for your current session by selecting Undo over and over again. A description of the previous action appears on the pop-up menu. If you have performed no action, there is nothing to undo and so Undo is not available for selection and no action appears to the right of the word Undo.
Restores the previous undo action. If you have performed no action, there is nothing to Redo and so Redo is not available for selection and no action appears to the right of the word Redo.
Selects all of the items in the graph. When you choose Select All, any previous selections are ignored. Selection state returns to the original setting.
When selected, all of the items become unselected. All items appear in the unselected color (gray, by default) or are hidden in the graph (if hide unselected is active).
Reverses the selection state of items. Selected items become unselected and unselected items become selected.
Excludes (temporarily removes) items from the graph.
Restores the items you excluded. If you accidentally excluded the unselected, this menu option restores those excluded items.
Enables you to save the graph to a GIF or JPEG file.
Enables you to copy the selected component and paste it to another file.
Takes you to the collection of tabs available for the respective visualization component. Common tabs include Data, Selecting, and Colors.
| WebFOCUS |