Building an Analytic Dashboard With Visual Discovery Components
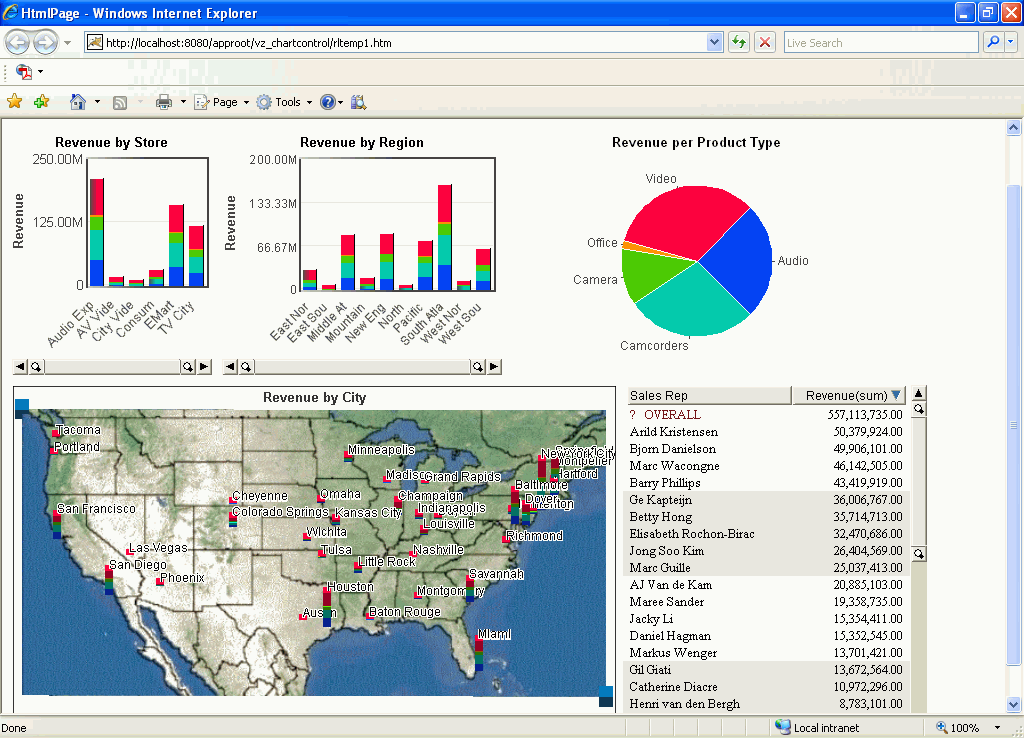
This tutorial shows you how to create an analytic dashboard
that contains two bar charts, a data constellation, a pie chart,
and a summary sheet. The first four components show revenue by different
values (store, region, city, product type). The last component (summary sheet)
shows various values (quantity, returns, and revenue) for each sales
representative. The data constellation is placed on top of a map
of the United States.
The final output looks similar to this:
Note: On any Web page, colors and appearance can vary
slightly from machine to machine. Visual Discovery is particularly
sensitive because it is an ActiveX object. Consequently, the images
included in this tutorial may appear slightly different from the
result you achieve.
Visual Discovery components use data from a .txt output file.
To understand how to create this type of file, see Developing an Analytic Dashboard. You create analytic dashboards using the following:
- HTML Composer, which
you can access from the Developer Studio Project area.
- WebFOCUS Environments:
Data Servers.
- Managed Reporting.
This
tutorial is created in the Project area.
Tip: As you perform the steps in the tutorial, save your
work frequently.
x
Procedure: How to Create the HTML File
-
In your
project or application folder, right-click the HTML Files folder
and select New, then select HTML
File.
If you are working in Managed Reporting, right-click a
Standard Report group and select New, HTML
File.
-
Enter vzMySales as
the file name and click Open.
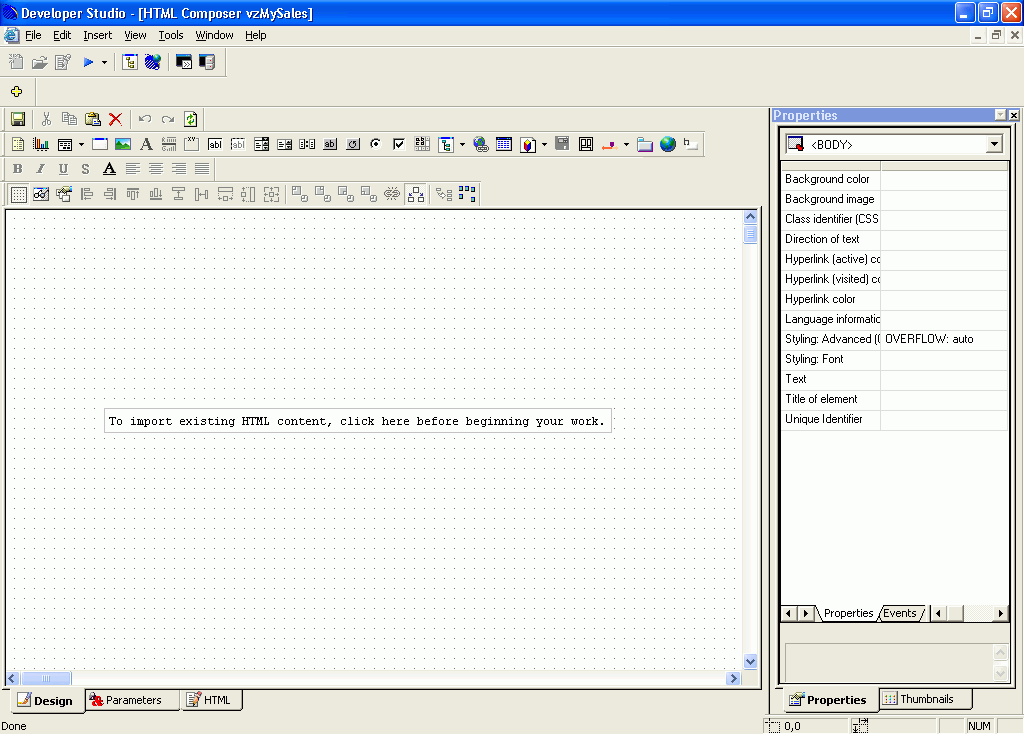
The HTML Composer opens.
x
Procedure: How to Create the Bar Charts
-
From
the Insert menu, select Components, then
click Visual Discovery Control.
-
Click
and drag your cursor on the canvas. The Insert ActiveX Control dialog
box opens.
-
Select Visual
Discovery Bar Chart and click OK.
-
Right-click
the Empty Bar Chart component and select ActiveX
Properties.
The Visual Discovery Bar Chart Properties dialog opens,
where you specify the characteristics of the bar chart. First you
need to associate data with the component.
-
Click Browse in
the Data tab.
-
Navigate
to your data file and click Open. In this
example, we are using a file named vzstoresales.txt. You can copy
this file to your current application from the \ibi\apps\session
directory.
-
On the
Properties dialog box, click Apply to bring
the data into the data pool of the component.
-
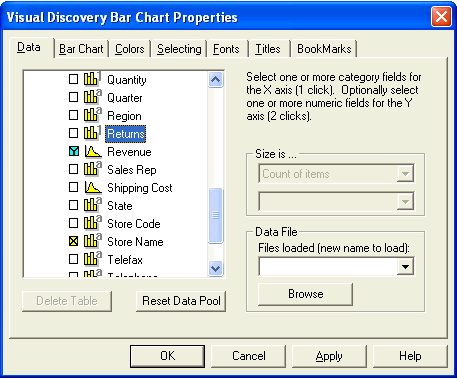
Expand
the data tree to see the available fields.
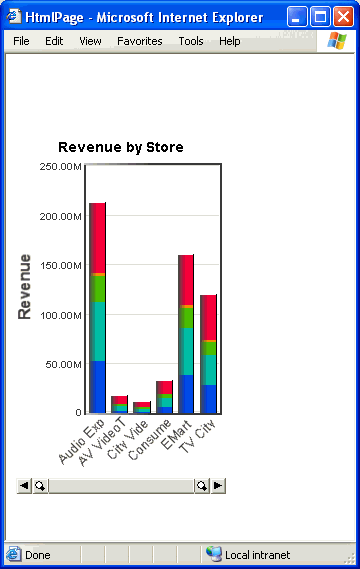
The bar chart in this example uses the Revenue and Store
Name fields.
-
Click:
- Twice on Revenue so
a Y appears in the box. This is the Y-axis field.
- Once on Store
Name so an X appears in the box. This is the X-axis
field.
-
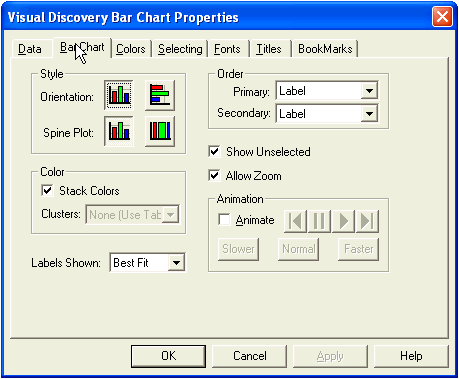
Click
the Bar Chart tab and confirm that the orientation
of the chart is set vertically by clicking the first icon in the
Orientation field.
-
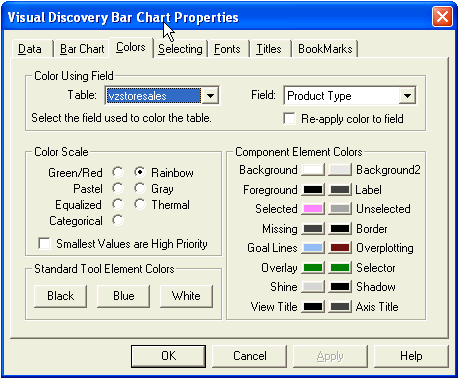
Click
the Colors tab. From the Field list, select Product
Type. This colors the bars according to the values in
the Product Type field.
-
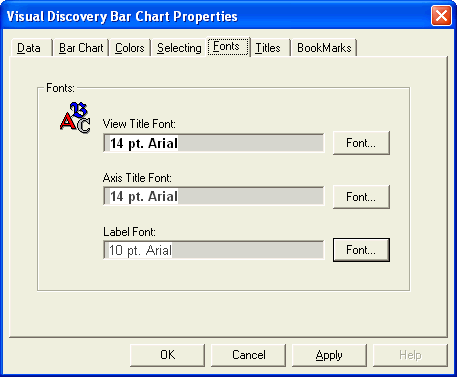
Click the Fonts tab.
For Label Font, click the Font button
and set Size to 10.
-
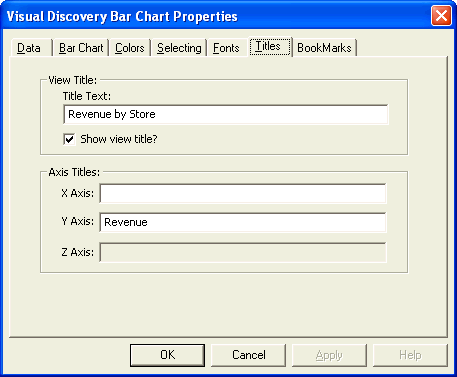
Click
the Titles tab and change the:
- Title Text
to Revenue by Store.
- X-Axis title
to blank (no title).
- Y-Axis title
to Revenue.
-
Click Apply and OK to
return to the HTML Composer.
-
Save
your work.
-
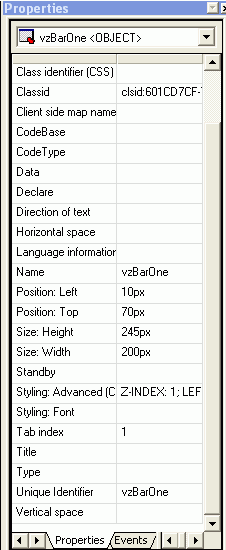
Access
the Properties pane on the right (if needed, select Properties from
the View menu).
From the Properties drop-down list, select activex1
<OBJECT> if not already selected. For information
on the way that Visual Discovery names components, see Naming Components.
Specify the attributes
as follows and then save your work:
- Unique Identifier: vzBarOne
- Name: vzBarOne
- Position: Left:
10px
- Position: Top:
70px
- Size: Height:
245px
- Size: Width:
200px
Tip: You do not need to enter “px” for
pixels. That is the default value.
-
Run
the Web page.
-
Close
the Web page to return to the HTML Composer.
-
Create
another bar chart component by repeating steps 1 through 18 in this
procedure. When you create the second bar chart, note the following:
- The vzstoresales.txt
data source is already part of the data pool.
- From the Data
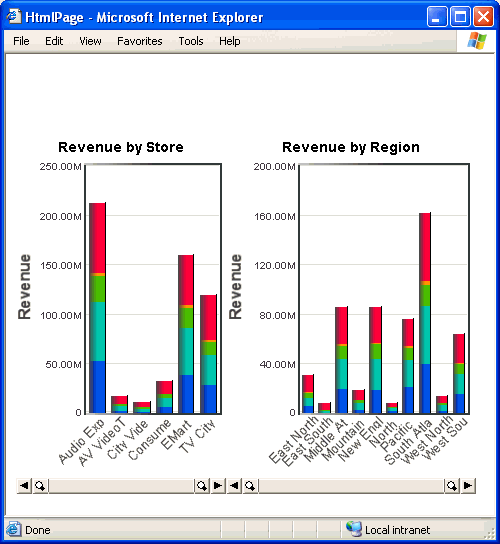
tab, select the field Region as the X-axis.
The field Revenue is the Y-axis.
- From the Bar
Chart tab, set Labels Shown to All.
- From the Titles
tab, supply the title text Revenue by Region and set the X-axis
title to blank.
- On the Properties
pane, remember to select activex1 <OBJECT> from
the drop-down list if not already selected. Set these attributes
as follows and then save your work:
- Unique Identifier:
vzBarTwo
- Name: vzBarTwo
- Position: Left:
220px
- Position: Top:
70px
- Size: Height:
245px
- Size: Width:
280px
-
Run
the Web page.
-
Close
the Web page to return to the HTML Composer.
x
Procedure: How to Create the Data Constellation
-
Insert
another Visual Discovery control.
-
This
time, select Visual Discovery Data Constellations.
We are going to bring in a map with dimensions of about
512 x 256. We want to make the size slightly larger than the dimensions
of the actual map so that we can see the handles of the graph. The
handles, which you will see when you run the report, enable you
to rotate the map.
-
Select
the Empty Data Constellations component,
right-click, and select ActiveX Properties.
On the Properties dialog box, note that the data source
is already available since you added it for the bar chart. Visual
Discovery components all share the same data pool. If you wanted
to add additional data, you could add more tables here.
-
Expand
the data tree, select City, and click Apply.
-
Click
the Data Constellations tab. In the:
- Label area,
select the Label selected check box.
- Node and Link
Selection area, select Nodes Only and No
Linking. This shows only the specific cities as data
points (nodes) and does not link the nodes.
- Uncheck Show
Unselected. When the Web page is run, this removes all
the glyphs that are not selected.

-
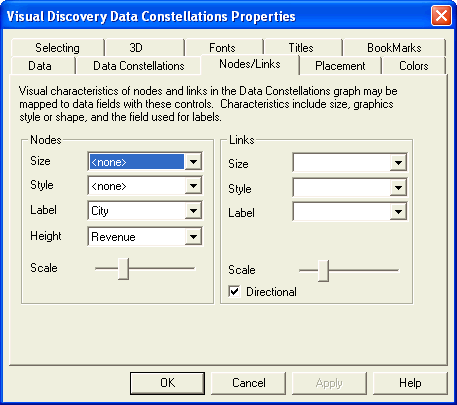
Click
the Nodes/Links tab. In the Nodes area, select City for
the Label and Revenue for the Height. This
labels all of the data points (nodes) with the value in the City
field and determines the height of the node from the value in the
Revenue field.
-
Click
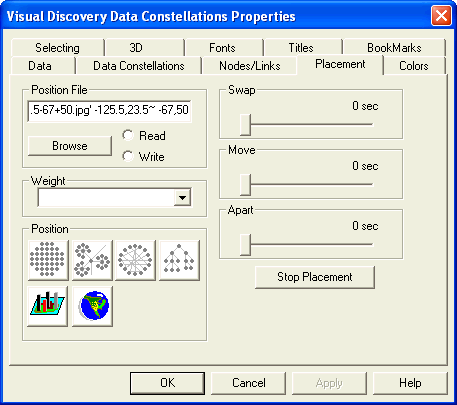
the Placement tab. Here you add the map image
and the coordinates for longitude and latitude. In the Position
File input area, three distinct parameter strings are required,
each separated by a space, as follows:
longfield,latfield 'imagepath' minmax1~ minmax2
where:
- longfield,latfield
Are the actual names in the data source for the fields that
contain the X,Y (longitude and latitude) coordinates for the nodes,
respectively.
- 'imagepath'
Is the full path of the map image. Use the Browse button
to enter this value.
- minmax1~ minmax2
Are the minimum X and Y (lower-left corner of the map) and
maximum X and Y (upper-right corner of the map) values, separated
by a tilde (~) and a space.
-
In the Position area, click the map position image (the first
image in the second row).
-
Click Browse and navigate to the map
file. In this example, we are using a file named usMainlandDark-125.5+23.5-67+50.jpg.
Change the Files of type drop down to All Files,
then copy this file to your current application from the \ibi\apps\session
directory.
-
Click in the Position File text box
and preceding the image path, enter the field names for the X, Y
(longitude and latitude) coordinates. Ensure there is a space between
Latitude and the path designation, for example:
Longitude,Latitude 'C:\ibi\apps\session\usMainlandDark-125.5+23.5-67+50.jpg'
-
In the Position File text box, go to
the end of the string. Add the minimum X and Y and maximum X and
Y values. Ensure the values are separated by a tilde (~) and a space,
for example:
Longitude,Latitude 'C:\ibi\apps\session\usMainlandDark-125.5+23.5-67+50.jpg'
-125.5,23.5~ -67,50
-
Click
the Colors tab. Confirm that Product
Type is selected from the Field drop-down list for Color
Using Field. This colors the nodes by the values in the Product
Type field.
-
Click
the 3D tab. Select Parallel from
the Projection field.

The
Axis Range will be adjusted later, directly in the code, from the
HTML tab. When you adjust the Axis Range, the effect is displayed
immediately in design view.
-
Select
the Fonts tab.
For Label Font, click the Font button
and set the Size to 9.
-
Select
the Titles tab and for the Title Text, enter Revenue
by City.
Confirm that the following is checked: Show view title.
-
Click Apply and OK.
-
Save
your work.
-
Access
the Properties pane on the right. From the drop-down list, select activex1 <OBJECT> if
not already selected.
Specify the following values and then save your work:
- Unique Identifier:
vzMap
- Name: vzMap
- Position: Left:
10px
- Position: Top:
325px
- Size: Height:
365px
- Size: Width:
605px
-
Click
the HTML tab located in the lower-left corner
of the HTML Composer window.
Locate the OBJECT tag with the id equal to vzMap.
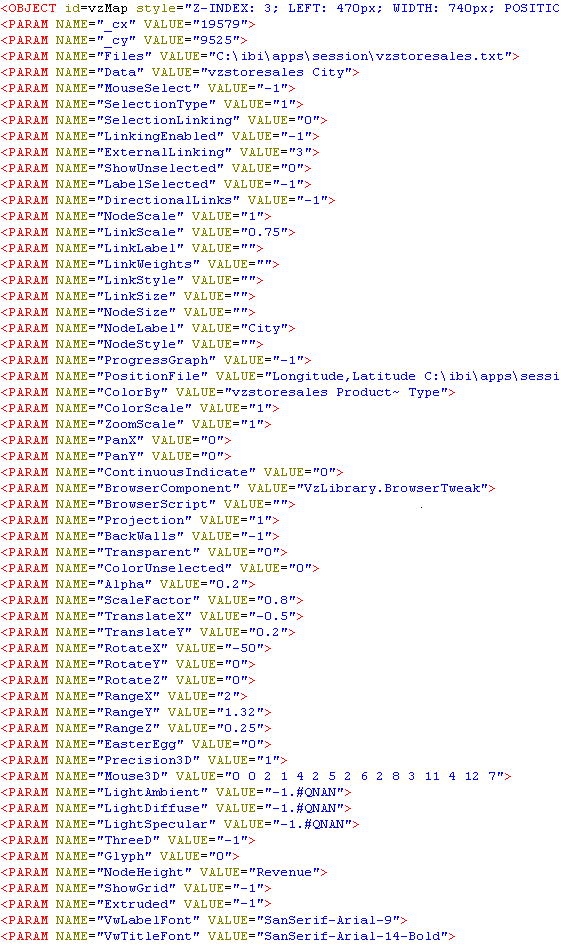
This
code determines the behavior of the ActiveX control. The VALUE for
each PARAM NAME is set in the Visual Discovery component Properties
pane.
-
Directly
in the code, specify the following values:
- Alpha: 0.2
- ScaleFactor:
0.8
- TranslateX:
-0.5
- TranslateY:
0.2
- RotateX: -42
- RotateY: .2
- RotateZ: 0
- RangeX: 2
- RangeY: 1.32
- RangeZ: 0.25
- Extruded: -1
-
Save
your work.
-
Click
the Design tab located in the lower-left
of the HTML Composer window.
-
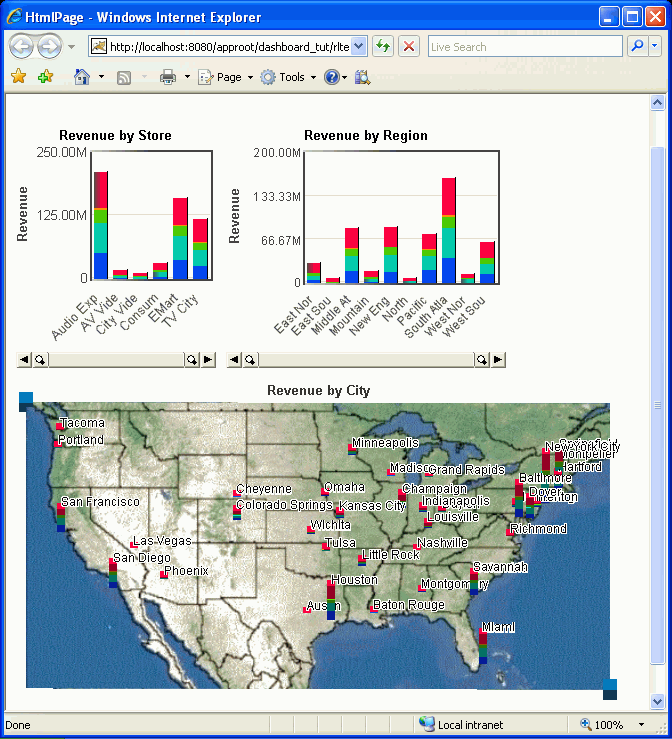
Run
the Web page.
You can drag the handles to reposition the map.
-
Close
the Web page to return to the HTML Composer.
x
Procedure: How to Create the Pie Chart
-
Insert
another Visual Discovery control and select Visual Discovery
Pie Chart.
-
Select
the Empty Pie Chart component, right-click,
and select ActiveX Properties.
-
On the
Data tab, expand the data tree and click:
- Once on Product
Type so an X appears in the box. This is the X-axis
field.
- Twice on Revenue so
a Y appears in the box. This is the Y-axis field.
-
On the
Pie Chart tab:
- Set Rotation
to 45.
- Set Labels
Shown to All.

-
Select
the Titles tab and change the Title Text
to Revenue by Product Type.
Confirm that the following is checked: Show view title.
-
Click Apply and OK.
-
Save
your work.
-
Access
the Properties pane on the right. From the drop-down list, select activex1 <OBJECT> if
not already selected.
Specify the following values and then save your work:
- Unique Identifier:
vzPie
- Name: vzPie
- Position: Left:
570px
- Position: Top:
70px
- Size: Height:
245px
- Size: Width:
250px
-
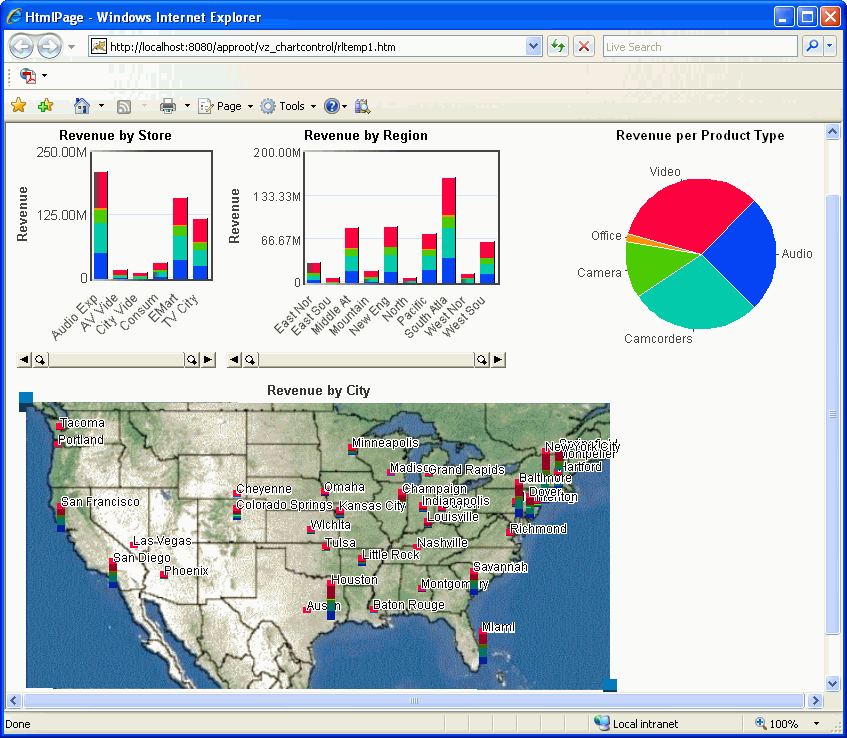
Run
the Web page.
-
Close
the page to return to the HTML Composer.
x
Procedure: How to Create the Summary Sheet
-
Insert
another Visual Discovery control and select Visual Discovery
Summary Sheet.
-
Select
the Empty Summary Sheet component, right-click,
and select ActiveX Properties.
-
On the
Data tab, select Sales Rep as the X-axis.
Select Revenue as the Y-axis.
-
Click
the Summary Sheet tab. Select Revenue from
the Sort By drop-down list and click Reverse Sort By.

-
Click Apply and OK.
-
Save
your work.
-
Access
the Properties pane on the right. From the drop-down list, select activex1 <OBJECT> if
not already selected.
Specify the following values:
- Unique Identifier:
vzSummary
- Name: vzSummary
- Position: Left:
620px
- Position: Top:
325px
- Size: Height:
365px
- Size: Width:
305px
-
Save
your work.
-
Run
the Web page. The final output looks similar to this:

-
Close
and save the page.


