- The (By) sort field used with REGRESS must be in a numeric or date format.
- REGRESS cannot operate on an ACROSS field.
- If any of the independent variables are also sort fields, they cannot be referenced in the request prior to the REGRESS sort field.
- FORECAST and REGRESS cannot be used in the same request, and only one REGRESS is supported in a request. Non-REGRESS RECAP commands are supported.
- The RECAP command used with REGRESS can contain only the REGRESS syntax. REGRESS does not recognize any syntax after the closing semicolon (;).
- Although you pass parameters to REGRESS using an argument list in parentheses, REGRESS is not a function. It can coexist with a user-written subroutine of the same name, as long as the user-written subroutine is not specified in a RECAP command.
- BY TOTAL is not supported.
- MORE, MATCH, FOR, and OVER are not supported.
- The process of generating the REGRESS values creates extra columns that are not printed in the report output. The number and placement of these additional columns varies depending on the specific request. Therefore, use of column notation is not supported in a request that includes REGRESS.
- SUMMARIZE and RECOMPUTE are not supported for the same sort field used for REGRESS.
- REGRESS is not supported for the FOCUS GRAPH facility.
- The left side of a RECAP command used for REGRESS supports the CURR attribute for creating a currency-denominated field.
- Fields with missing values cannot be used in the regression.
- Larger amounts of data produce more useful results.
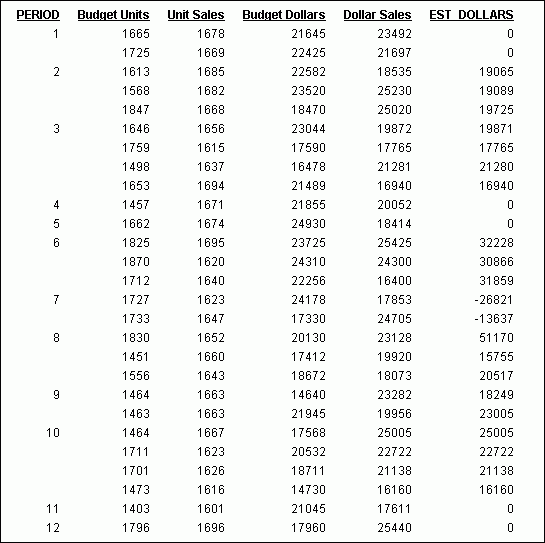
The following example uses the GGSALES data source to calculate an estimated DOLLARS column. The BUDUNITS, UNITS, and BUDDOLLARS fields are the independent variables. The DOLLARS field provides the actual values to be estimated.
- Create a new procedure and open the ggsales.mas file in Report Painter.
- Select Report at
the top of the Report Painter window, then select Define from
the drop-down list.
The Define dialog box opens.
- Enter MONTH in the Field input area, type M (a date format) in the Format input area, then double-click DATE in the Fields List to add it to the area below PERIOD, then click New.
- Enter PERIOD
in the Field input area, type I2 (Integer format) in the Format
input area, then type MONTH in the area below PERIOD, then click OK.
The Define dialog box closes and you return back to Report Painter.
- Add the PERIOD, BUDUNITS, UNITS, BUDDOLLARS, and DOLLARS fields to the report.
- Select the PERIOD field, and click the By button.
- Click the Where/If button.
The Report Options dialog box opens.
- Enter CATEGORY EQ 'Coffee' in the Expression field, and click New.
- Enter REGION EQ 'West' in the Expression field, and click New.
- Enter UNITS GT 1600 AND UNITS LT 1700 in the Expression field, and click OK.
- Click the Forecast button.
The Forecast window opens.
- In the Field Name field, enter EST_DOLLARS.
- From the Step 1: Choose a Method drop-down list, select Multivariate Regression.
- From the Step 2: Choose the First Independent Variable drop-down list, select BUDUNITS.
- From the Step 3: Choose Another Independent Variable drop-down list, select UNITS.
- From the Step 4: Choose Another Independent Variable drop-down list, select BUDDOLLARS.
- From the Step 5: Choose the Dependent Variable drop-down list, select DOLLARS.
- Click OK.
When the report is run, the multivariate regression values appear in the EST_DOLLARS column. The output is:

TABLE FILE GGSALES
PRINT BUDUNITS UNITS BUDDOLLARS DOLLARS
ON TABLE RECAP ESTDOLLARS/F8 = REGRESS(3,BUDUNITS, UNITS, BUDDOLLARS,
DOLLARS);
WHERE CATEGORY EQ 'Coffee'
WHERE REGION EQ 'West'
WHERE UNITS GT 1600 AND UNITS LT 1700
END