In this section: |
Precision reports enable you to create perfectly aligned output for a preprinted form, such as a Bill of Sale or Shipping invoice. The Precision Report tool enables you to build an exact layout for a form by embedding data in headings and text objects, managing images, and drawing objects to fit specific positions. The Precision Report tool is accessible from Report Painter.
Note: Precision reports are available for PDF, DHTML, and PS output formats.
You can build the report in Report Painter and click the Precision Report button. The report then becomes a precision report. In order to create a new Precision Report, you are required to build a report in the Data Matrix and add fields as objects in the Headings/Footings of the layout.
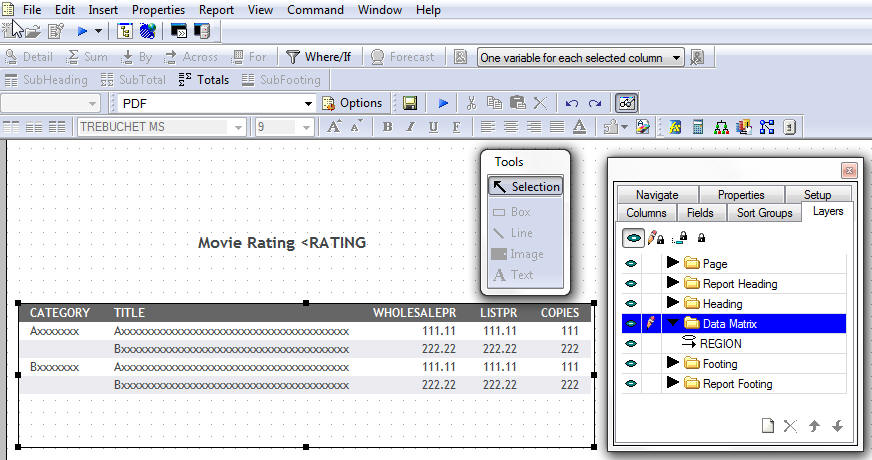
The following image is an example of the Precision Report tool.
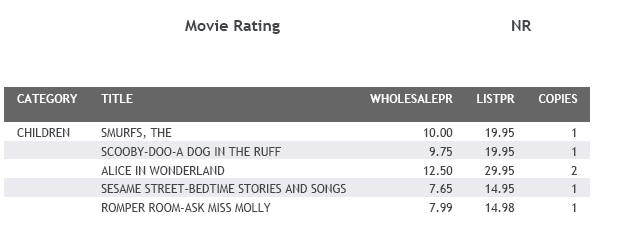
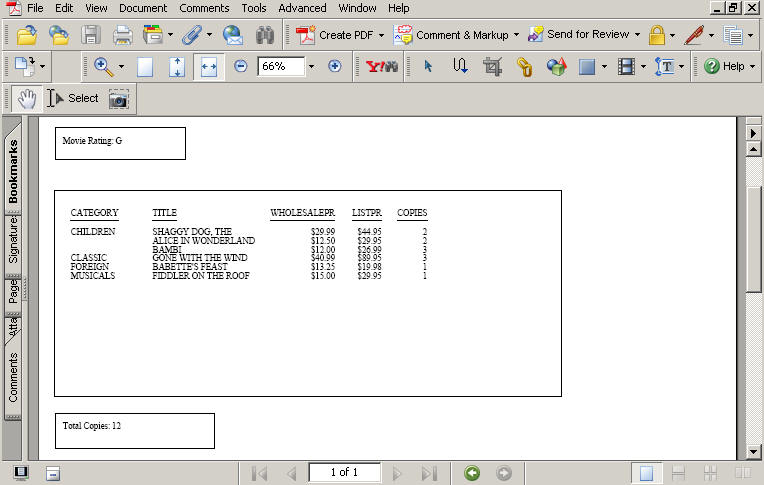
The following image is an example of the Precision Report output in PDF format.
How to:
Reference: |
The Precision Report tool is accessible from the Report Painter General toolbar. You may convert an existing report to a Precision report, or create a new one.
Note: Once a Precision Report has been saved, it will automatically open in the Precision Report tool.
The Procedure Viewer opens. If the original procedure (.fex) was created by specifying Create with Report Painter, Procedure Viewer will not open.
The report opens in Report Painter.
 ,
located on the General Toolbar.
,
located on the General Toolbar.
A Style warning message appears indicating that the report will be converted to a Precision Report.
Note: Once a Precision Report has been saved, it will automatically open in the Precision Report tool.
The existing report is converted to a Precision report. You may edit the existing data and change the alignment and position of the objects in report.
Note: The report output will automatically change to PDF output in the Precision Report tool. Optionally, you may select DHTML or PS as the output format.
The following apply to the use of converting existing reports to Precision reports:
Your report is using a locked format that is not supported by Precision Report.
Note: You can create a Report Heading Layer and Report Footing Layer in the Precision Report tool.
The Procedure Viewer opens. If the original procedure (.fex) was created by specifying Create with Report Painter, Procedure Viewer will not open.
The Open dialog box appears.
Report Painter opens.
,
located on the General Toolbar.
A Style warning message appears indicating that the report will be converted to a Precision Report.
Note: Once a Precision Report has been saved, it will automatically open in the Precision Report tool.
The report is converted to a Precision report. You may build the report and add fields as objects. For details on how to build a Precision report, see Creating Precision Reports.
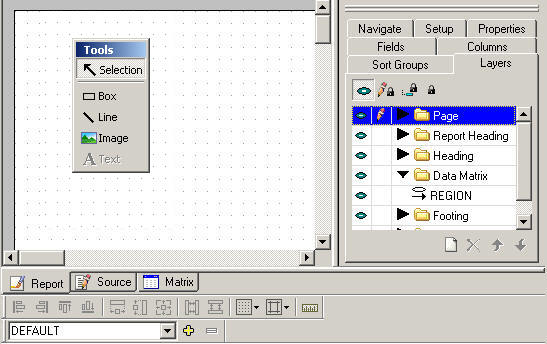
The Precision Report layout is similar to the Report Painter layout with additional Tools and Palettes, enabling you to design the exact layout of your preprinted form.
The layout of the Precision Report tool is a grid that contains a placeholder for your report (the Data Matrix). You can snap objects (such as lines, images, and so on) to the layout. These placeholder objects can be positioned and aligned according to the layout of the items on your preprinted form.
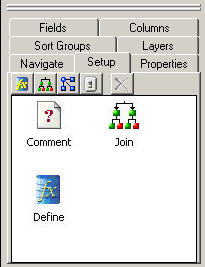
The Precision Report Tools box contains buttons that provide quick access to commonly performed functions that you may use in the Headings and Footings of the Precision Report layout. Headings and Footings enable you to create fields using variables from the reporting object (the Data Matrix).
The behavior of the tools options are determined either by the selected object or the previously performed command or action. Therefore, depending upon your location in the Precision Report tool or previously performed actions, certain tool buttons may be inactive.
The Precision Report Tools box is displayed in the layout. You may move the Tools box.
The following table lists and describes the objects in the Precision Report tools box.
|
Button |
Definition |
|---|---|
|
|
The Selection button indicates that the items in the Data Matrix, Headings, and Footings can be selected. Tip: Click the Selection button after inserting a box, line, image, or text to return to select mode. |
|
|
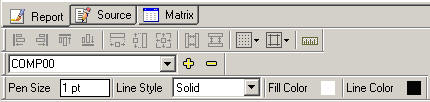
Inserts a box in the Heading or Footing layer. Note: When you select the Box object from the Tools box, the Box toolbar appears with options to set the pen size, line style, fill color, and line color. This sets the box options until you change them again.
The cursor changes into a crosshair. Click and drag the crosshair on the canvas to create the box object and adjust it to the size you want. |
|
|
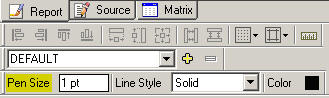
Inserts a line in the Heading or Footing layer. Note: When you select the line object from the Tools box, the Line toolbar appears with options to set the pen size, line style, and line color. This sets the line options until you change them again.
The cursor changes into a crosshair. Click and drag the crosshair on the canvas to create the line object and adjust it to the size you want. |
|
|
Inserts an image in the Heading or Footing layer. The cursor changes into a crosshair. Click and drag the crosshair on the canvas to create the image object and adjust it to the size you want. Select the image from the Open dialog box. |
|
|
Inserts text in the Heading or Footing layer. Note: When you select the text object from the Tools box, the Font toolbar appears with options to set the font type, size, color, and text formatting. This sets the font options until you change them again.
The cursor changes into a crosshair. Click and drag the crosshair on the canvas to create the text object and adjust it to the size you want. Enter the text, or embedded field, as the input field for your form. |
For more information about using these objects in Headings and Footing, see Creating Precision Reports.
Alignment options enable you to multi-select objects and easily position them relative to one another. These options are available from the Alignment toolbar in the Precision Report tool.
Note: You may only align objects that are in the same layer. For example, you may align multiple Heading objects, or multiple Footing objects but you may not align Heading and Footing objects.
The behavior of the Alignment buttons are determined either by the selected object or the previously performed command or action. Therefore, depending upon your location in the Precision Report tool or previously performed actions, certain Alignment buttons may be inactive.
The Alignment toolbar is displayed in the layout by default. You may move or hide this toolbar.
Tip: Select Alignment from the View/Toolbars menu to view or hide the Alignment toolbar.
The Alignment toolbar contains the following buttons:
|
Button |
Description |
|---|---|
|
|
Aligns objects to the left. |
|
|
Aligns objects to the right. |
|
|
Aligns objects by the top of the highest selected object. |
|
|
Aligns objects by the bottom of the lowest selected object. |
|
|
Makes two or more objects the same width. |
|
|
Makes two or more objects the same height. |
|
|
Makes two or more objects the same size. |
|
|
Space evenly across for the objects selected. Tip: To select multiple objects, use the Shift key. |
|
|
Space evenly down for the objects selected. |
|
|
Show/hide the grid in the Precision Report layout. Snap/unsnap the objects to the grid. |
|
|
Show/hide guides in the Precision Report layout. Snap/unsnap the objects to the guides. Note: These options are applicable when the page ruler is on. |
|
|
Toggles the page ruler on/off in the Precision Layout tool. |
Composition options enable you to create composition templates that run the same Precision report with different properties. This may be beneficial if you need to run a Precision report with modifications for internal and external use.
These options are available from the Composition toolbar in the Precision Report tool.
The Composition toolbar is displayed in the layout by default. You may move or hide this toolbar.
Tip: Select Composition from the View/Toolbars menu to view or hide the Composition toolbar.
The Composition toolbar contains the following buttons:
|
Button |
Description |
|---|---|
|
|
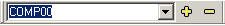
The composition selection list. The DEFAULT composition shows the original Precision report and cannot be deleted. |
|
|
Add Composition enables you to create a composition template. |
|
|
Remove composition deletes the composition template from the selection list. |
For details on how to use compositions, see How to Run Different Compositions for the Precision Report.
There are several palettes that appear in the Precision Report layout. These palettes enable you to design and create positioned elements for your report.
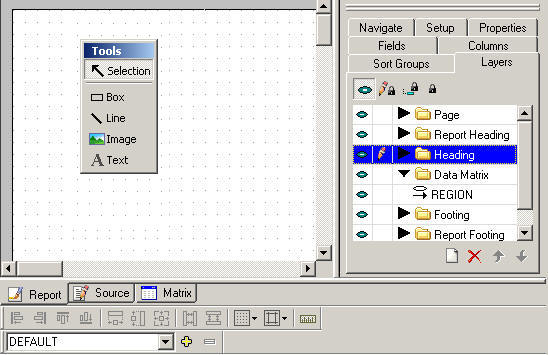
The Layers palette is the main palette where the Data Matrix, Heading, and Footing layers are created.
The Precision Report palettes are displayed in the layout by default. You may move or hide these palettes.
Tip: Select Palettes from the View menu to view or hide the Precision Report palettes.
Note: The arrangement of the palettes may appear differently, depending on which palette was selected last.
The Layers palette consists of the Page, Report Heading, Heading, Data Matrix, Footing, and Report Footing layers by default.
![]()
There are several Layer icons available on the Layers palette. The icons and their meanings are defined in the following table:
|
Icon |
Definition |
|---|---|
|
|
Show/Hide the selected layer in the Precision Report layout. |
|
|
Enable/Disable styling changes. |
|
|
Enable/Disable data changes. |
|
|
Enable/Disable all changes. |
|
|
Creates a new layer for the Precision Report. The Layers palette consists of the Page, Report Heading, Heading, Data Matrix, Footing, and Report Footing layers by default. Note: If any layer is deleted, the option is available to create the layer from the Create new layer icon. |
|
|
Deletes the selected item and all of its layers. |
|
|
Moves the selected item up or down in the selected layer. |
You can view and modify the sorting properties of fields in the Data Matrix from the Sort Groups palette in the Precision Report tool.
![]()
The Sort Groups palette displays the sorting method being applied to each column in the Data Matrix window. You can change the sorting method (for example, from By to Across or from Detail to Sum) by using the right-click context menu. The changes are reflected in the Columns and Sort Groups palettes and in the Data Matrix window.
You can also use the Sort Groups palette to create multi-verb requests. For more information, see Sorting in Groups to Create a Combined Detail/Summary Report.
The icons in the first column to the left of the field name display the type of sort field. The icons and their meanings are defined in the following table:
|
Icon |
Definition |
|---|---|
|
|
Across field. |
|
|
By field. |
|
|
Sum field. |
|
|
Detail field. |
|
|
For field. |
You can view and modify the columns in the Data Matrix window from the Columns palette in the Precision Report tool.
![]()
Right-clicking a column and selecting Options from the context menu opens the Field Properties dialog box where you can format and style your column, as well as apply drill down capabilities. Any changes made to the column properties are reflected in the Data Matrix layer.
You can view the fields list in the Data Matrix as a:
You can double-click or drag segments or fields from this palette to the Data Matrix window, where they become report columns. You can customize how you view the fields list and save your settings. You can also search for fields in the fields list.
When you select an attribute object or layer, its properties are reflected in the Properties palette in the Precision Report tool.
![]()
To edit properties, there are drop-down lists, input fields, and Yes/No options in the value column. Click the symbol to edit the property.
Clicking a component in the Setup palette opens the tool that created the component. Right-clicking a component in the Setup palette and selecting Hide Details section displays the syntax for that component in the Precision Report tool.
You may view the entire layout of the Precision Report in the Navigate palette.
![]()
For more information about using these palettes in the Precision Report layout, see Creating Precision Reports.
How to: |
The Precision report is created by using the Data Matrix as the reporting object, and by inserting objects in the Headings/Footings layers as fields.
Note: REGION displays as a placeholder for the Data Matrix object regardless of which Master File you use and what fields are selected.
The Data Matrix object is shown in the layout.
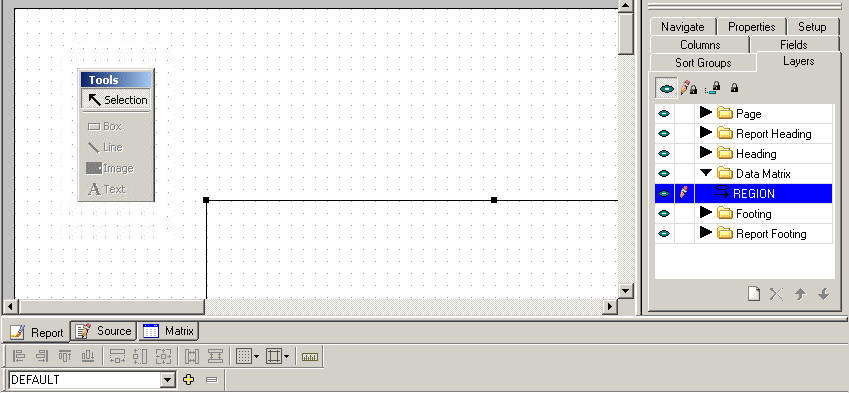
A hand displays in the Data Matrix enabling you to begin building or editing your report, and the basic Report Painter functions are enabled.
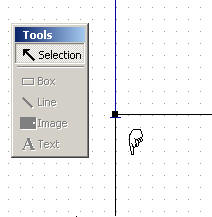
Note: You may resize the Data Matrix placeholder at anytime in Selection mode.
Once the report has been built in the Data Matrix, you may design the page layout for the Precision Report. Objects added to the page layout appear on each page of the form at run time.
The Tools objects are enabled.
This toolbar appears underneath the Alignment toolbar when the box object is selected. Set the pen size, line style, fill color, and line color for the box object. This sets the box options until you change them again.
This toolbar appears underneath the Alignment toolbar when the line object is selected.
Note: The Text object is not available for the Page layer.
The cursor changes into a crosshair.
Note: Objects snap to the grid for perfect alignment.
As items are added to the page layout and appear under the Page layers.
Tip: Once the line object has been added to the Page layer, you may use the Properties palette to change the pen options.
When you run the report, the items added to the Page layer appear on every page of the report output.
Once the report has been built in the Data Matrix, add Heading and Footing objects as placeholders for fields on your form.
The Tools objects are enabled.
These toolbars appear underneath the Alignment toolbar when the box, line, or text objects are selected.
The cursor changes into a crosshair.
Note: Objects snap to the grid for perfect alignment.
As items are added, they appear under the Heading/Footing layers.
You may embed fields and variables in your Heading/Footing layers as text objects. The Precision Report retrieves the value for the field when the report is run.
Note: If adding embedded fields, values are calculated differently in Heading and Footings. Headings use the first value on the page of the report, and Footings use the last value on the page of the report.
To embed field values in a Heading or Footing text object:
This includes Report Variables, Computed, and Defined fields.
The field is added to the text object as <FIELDNAME.
Tip: The list of available operators adjusts to show those that are appropriate for the type of field you select.
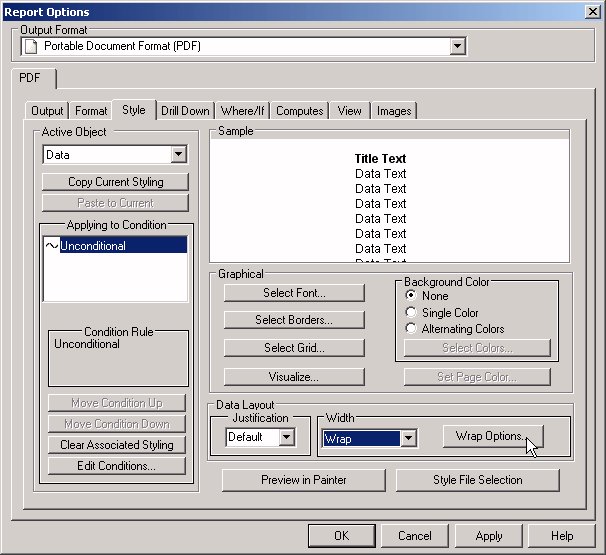
You can use the WrapGap option in a StyleSheet to control spacing between wrapped lines in PDF and PostScript report output. The WrapGap option is available for only an active object of type Data.
The Wrap Options button displays next to the Width drop-down box.
You may run the Precision report with different composition templates. Composition templates enable you to run the same Precision report with different properties. This may be beneficial if you need to run a Precision report with modifications for internal and external use. For example, you have an internal report that shows your trademark image in the Report Heading Layer. You can create a composition template that hides your trademark image for an external customer.
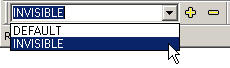
The composition selection list creates a template name.
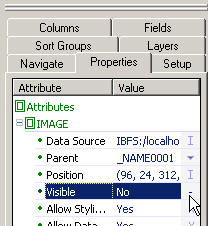
For example, in the Properties palette below, the Visible property for the image object was changed to No, thus removing the image from the layout.
The composition template is added to the composition selection list. As per this example, the composition template saved hides the image in the Precision report.
Note: The DEFAULT composition cannot be deleted.
A confirmation message appears indicating that the composition template will be deleted.
The composition template is removed from the composition selection list.
The Precision report runs with the values specified in the Properties palette for the selected composition.
The following example shows how to create a form by Ratings and Total Copies for Movies.
Report Painter opens.
, located
on the General Toolbar.A Style warning message appears indicating that the report will be converted to a Precision Report.
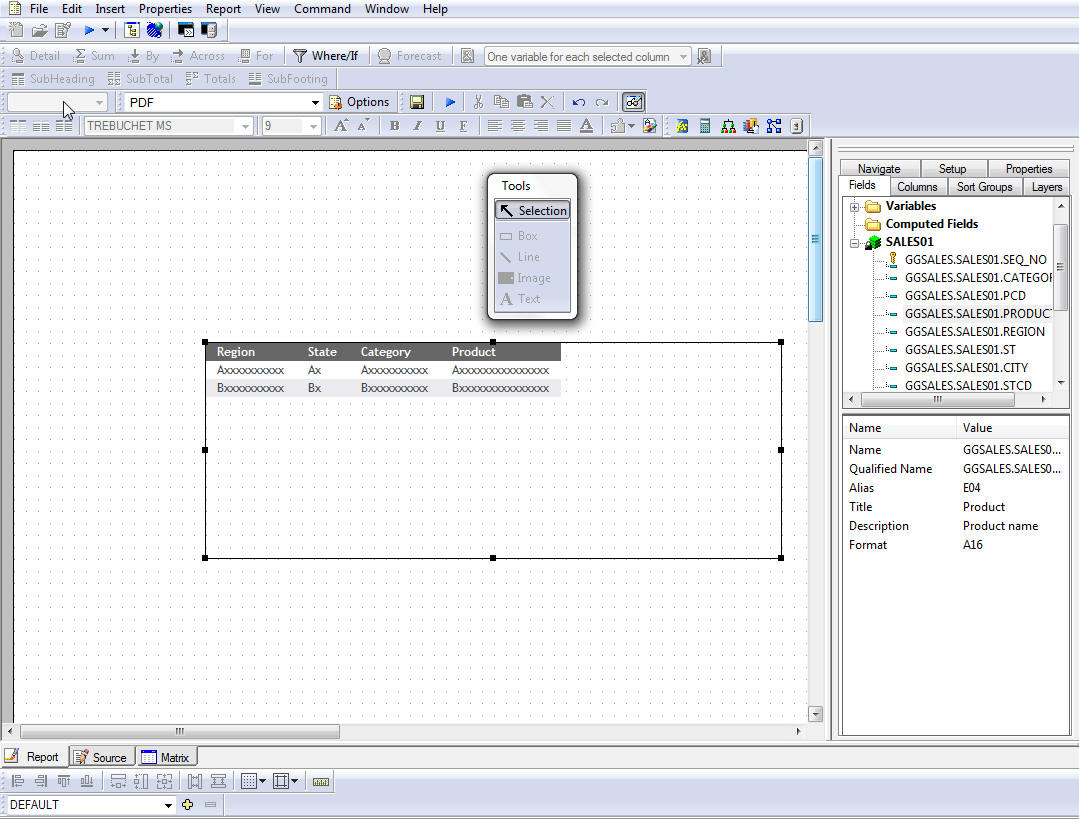
The Data Matrix object is selected in the layout.
The fields are added to the Data Matrix.
Note: Not all fields may be visible in the layout. Use the Navigate palette to view all pages and fields in your layout.
Select Where/If from the Columns toolbar.
The Report Options dialog box opens as the Where/If tab.
The Field Properties dialog box appears.
All of the fields should now be visible in the layout.
You may add a box, line, or image element to the page layer.
Movie Rating: <RATING is added as the embedded field in the text element.
Total Copies: <COPIES is added as the embedded field in the text element.
Total Copies: <TOT.COPIES is added as the embedded filed in the text element.
The form appears, showing the total copies for movies with a G rating.
| WebFOCUS |