Creating the Layout and the Report
Here you will create the layout for the project and
add elements to it, such as text, background color, reports, images,
and a target frame for the drill-down output. You will also customize
the parameters and rearrange the items in your layout.
For the report (which you will create directly from the layout),
you will add calculated values, Where statements to limit the data
in the report, and drill-down capabilities. You will also style
the report with color, borders, and a page heading.
x
Procedure: How to Create the Report Layout
Complete
the following steps to create a Layout procedure called PRODREP.
-
Right-click
the HTML Files folder under the Century project.
-
Select New,
then select HTML File from the context menus.
The Add HTML dialog box opens.
-
Type PRODREP in
the File name text box.
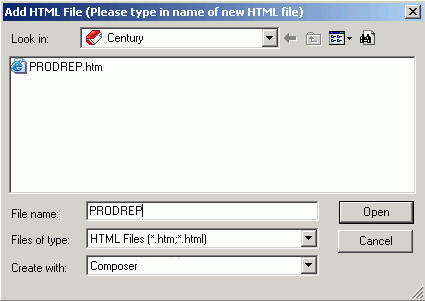
Note: Composer
is selected as the default.
-
Click Open.
The HTML Composer opens,
as shown in the following image.
x
Procedure: How to Add Text and Color to the Layout
Add
a heading to your application, style the heading, and add a background
color.
-
Click
the Insert text
 button.
Your mouse pointer will change to crosshairs.
-
Click
and drag the crosshairs to create a rectangular text box.
You can resize the box after you enter and style the text.
-
Click
on the box and type Century Corporation Product Report
and Graph.
-
Click
anywhere outside of the heading text box, then right-click the text box
and select Style from the context menu.
The Style Composer dialog box opens with Font highlighted
in the list at the far left.
-
To set
the font type, in the Font name area, select the Family option,
then click the ellipsis button to the right. The Font Picker dialog
box opens, select Arial in the Installed
fonts area, click the right arrow to move Arial to the Selected
fonts area, and click OK.
-
To set
the font style, select Bold from the Absolute
drop-down list in the Bold area.
-
To set
the font size, in the Size area, select px from
the Specific drop-down list and type 16 in the input area
to the left.
-
To set
the font color, select Navy from the Color
drop-down list in the Font attributes area.
-
To set
the text alignment, select Text below Background
in the list at the far left, then select Centered from the
Horizontal drop-down list in the Alignment area.
This centers the heading text horizontally within the text box.
-
To set
the heading background color, select Background below
Font in the list at the far left, then select the Transparent option
below the Background color menu.
This allows the light color you will select for the background
color to show through the heading.
-
Click OK to
close the Style Composer.
-
Resize
the heading text box as necessary by clicking and dragging the borders.
-
To set
the background color for the HTML page, select BODY from
the top drop-down list in the Properties tab of the Properties bar.
-
Click
once in the empty field to the right of Background color, then click the
ellipsis button that appears at the far right of the empty field.
The Color Picker dialog box opens.
-
Select
any light color and click OK.
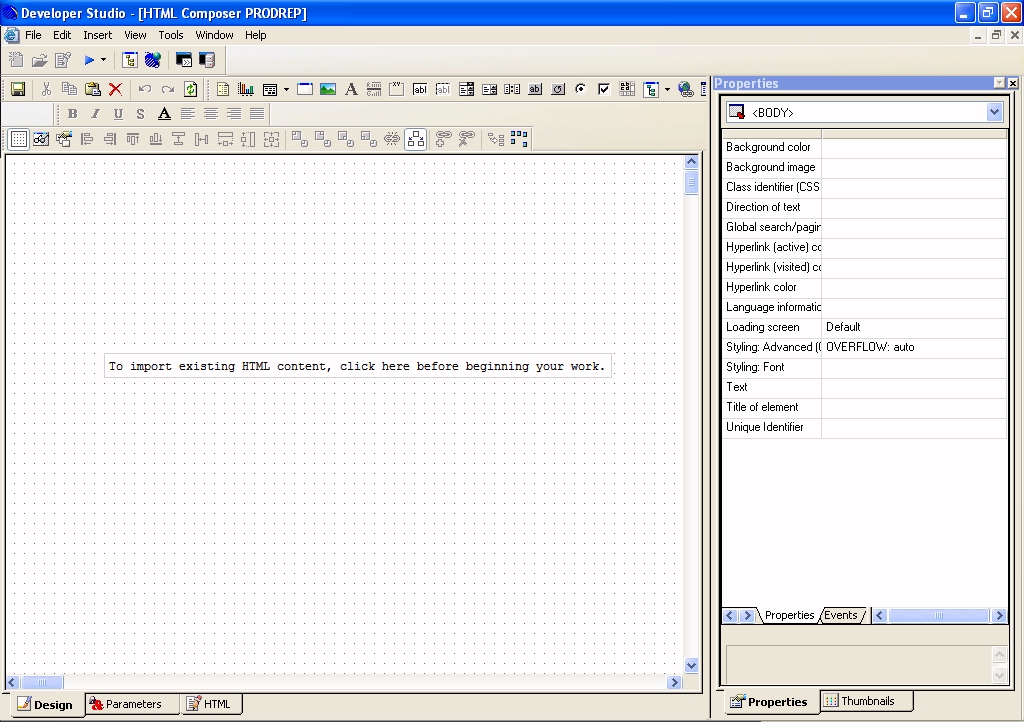
The following image shows how the HTML Composer should
appear at this point, depending on the size of your text box.
x
Procedure: How to Create a Report From the Layout
You will now create the report in
the Report Painter which is accessed directly from the HTML Composer.
-
Click
the Report
 button.
The mouse pointer changes to crosshairs.
-
Click
and drag the crosshairs and create a report area placeholder.
Note: You can resize and reposition the report placeholder
at any time.
-
Double-click
the report placeholder.
The Open dialog box opens.
-
Select
the CENTORD Master File and click Open.
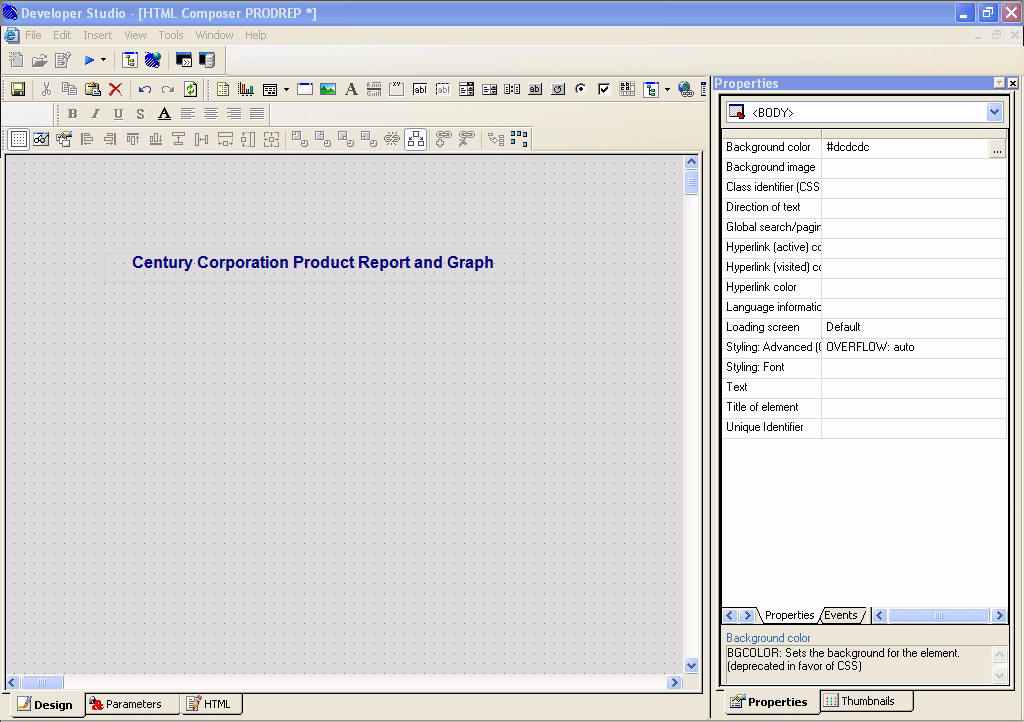
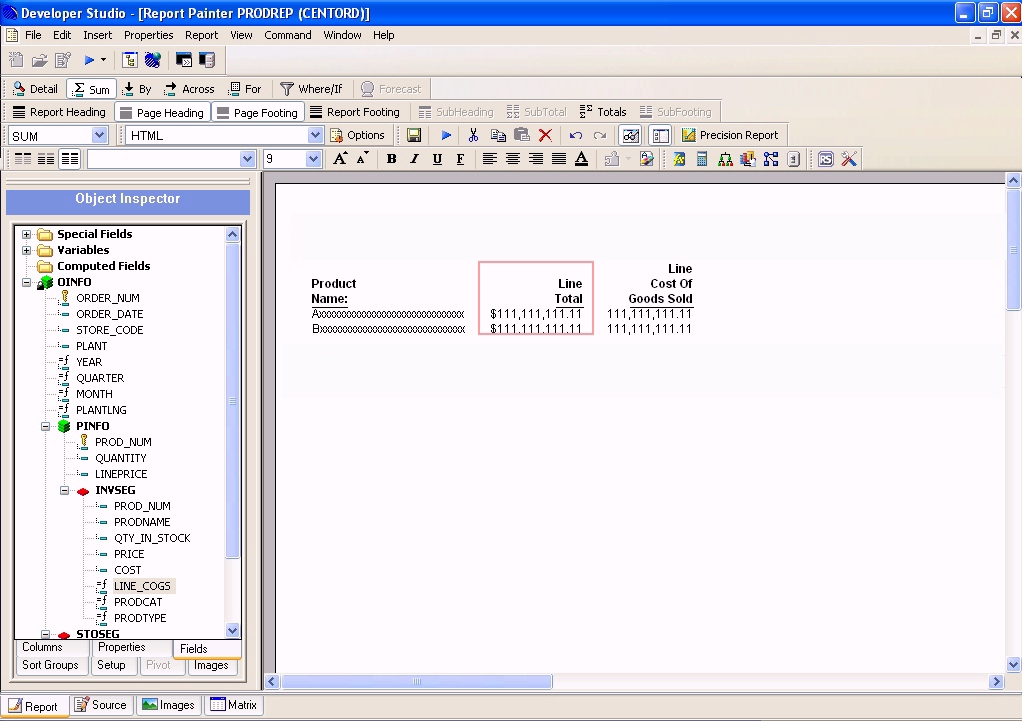
The following image shows the Field Tree in the Report
Painter window. The Object Inspector, located in the left pane,
lists the fields in the CENTORD Master File.
Note: To
change the Object Inspector to Field Tree view, right-click in the Object
Inspector and select Show Field Tree.
-
Double-click
the following fields in the Object Inspector Fields tab to add them
to the report:
-
PRODNAME (in
the INVSEG directory)
-
LINEPRICE (in
the PINFO directory)
-
LINE_COGS (in
the INVSEG directory)
-
Select
the Product Name field and click the By
 button
on the toolbar. This sorts all of the data vertically by product
name.
button
on the toolbar. This sorts all of the data vertically by product
name.
-
Select
the Line Total column and click the Sum
 button.
This sums the data in the Line Total column.
button.
This sums the data in the Line Total column.
The following image shows how the new report should appear
at this point.
x
Procedure: How to Add a Calculated Value to the Report
Continue
creating your report by adding a calculated value, called PROFIT.
This field is created using a calculation with two existing fields
in the CENTORD data source, LINE_PRICE and LINE_COGS.
-
Select Computes from
the Report menu, or click the Computes button
from the Setup toolbar.
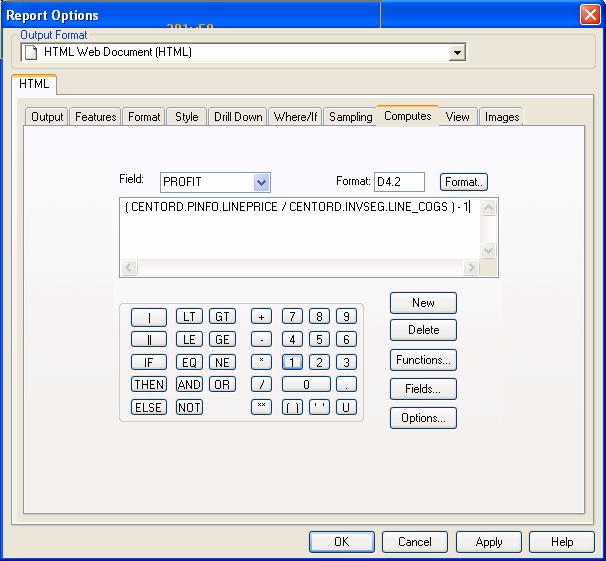
The
Report Options dialog box opens at the Computes tab.
-
Type PROFIT in
the input area labeled Field.
-
Type D4.2 in
the input area labeled Format.
Tip: In this case, you know the exact format you
want for this field. If you are unsure of the format and want to
see all available formats, click the Format button
to access the Format dialog box.
-
Place
the cursor in the box below the input area labeled Field.
-
Create
the following expression: (LINEPRICE / LINE_COGS) – 1.
To create this expression:
- Click the Fields button.
- Double-click LINEPRICE in
the CENTORD field list box.
- Click the forward
slash (/) on the Report Options calculator.
- Double-click LINE_COGS in
the CENTORD field list box.
- Highlight the
statement and click the double parentheses ( ).
- Click the minus
(-) sign and then the number 1.
The following image shows how the Report
Options expression should appear.
-
Click OK.
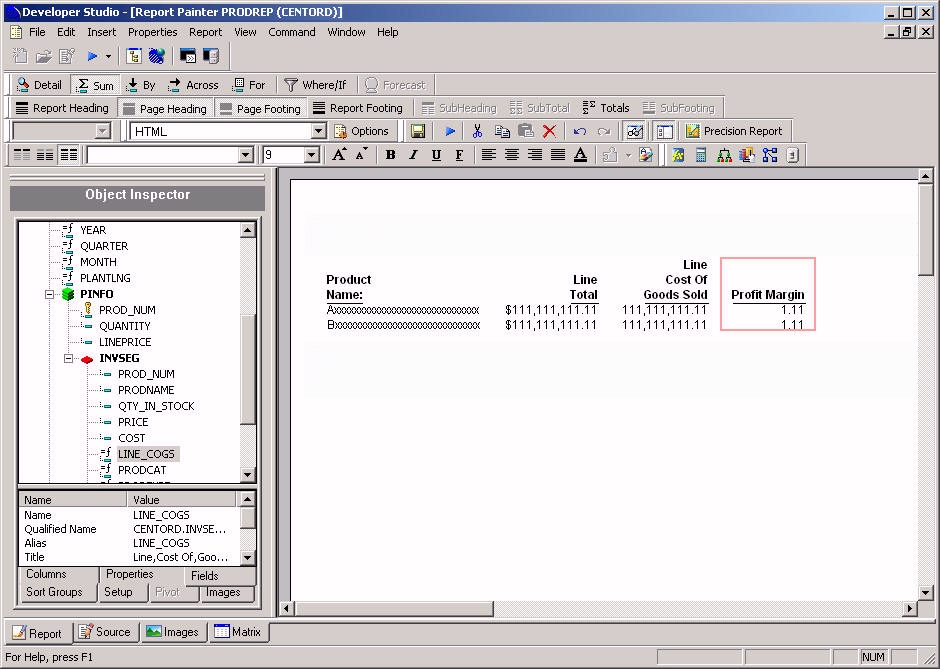
The new column PROFIT is added to the Report Painter window.
-
Select
the PROFIT column and then click the Sum
button.
-
Right-click
the PROFIT column and select Column
Title.
-
Change
the title by typing Profit Margin.
-
Click OK.
The following image shows how the report should appear
at this point.
x
Procedure: How to Limit the Data to a Selected Plant and Year
You
will now create a list of acceptable values for the plant location
and the year. These are the values the user will be able to select
when they are using this application. Later, you will use each set
of values you create here to run a parameterized report.
To do this, you will need to create two
Where statements.
-
Click
the Where/If
 button
on the toolbar.
button
on the toolbar.
The Report Options dialog box opens at the Where tab.
-
Click Assist.
The Expression Builder opens.
-
To create
the first Where statement:
- From the Fields
list, double-click PLANT (under Location
Dimension).
- From the Logical
Relation drop-down list, select equals.
- In the Compare
Type box, select Parameter.
- Double-click
the Compare Value box to open the Variable Editor.
-
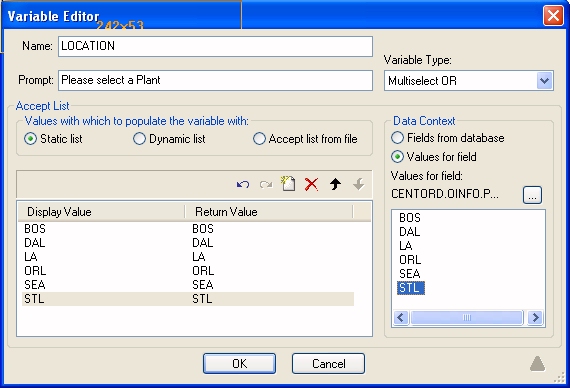
In the
Variable Editor:
- For Name, type LOCATION.
- In the Prompt
input field, type Please select a Plant.
-
From
the Variable Type drop-down list, select Multiselect OR.
-
In the
Data Context area, select Values for field.
-
Click
the Select a field ellipsis button to get values
for the PLANT field. The Value Retrieval dialog box opens.
The Value Retrieval dialog box provides a list of available
fields in your data source. Double-click the PLANT field
to close the Value Retrieval dialog box and return to the Variable
Editor. The available values for the PLANT field are listed.
-
Double-click
each of the following values (BOS, DAL, LA, ORL, SEA,
STL) to add them to the Accept List.
The following image shows the Variable Editor populated
with the values you selected.
-
Click OK to
close the Variable Editor.
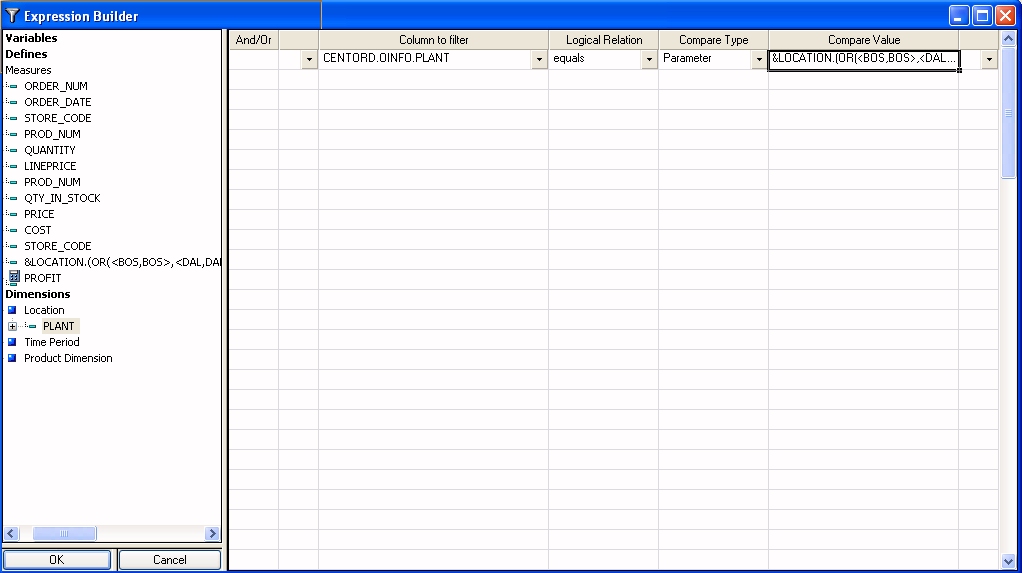
The following image shows the Expression Builder populated
with the values you selected.
-
Click OK to
close the Expression Builder and return to the Where/If dialog box.
Leave the Where/If dialog box open to create the next Where statement.
-
Click New from
the Where/If dialog box.
-
Click Assist.
The Expression Builder opens.
-
To create
the second Where statement:
- From the Fields
list, double-click YEAR (under the Time Period
Dimension).
- From the Logical
Relations drop-down list select equals.
- In the Compare
Type box select Parameter.
- Double-click
in the Compare Value box to open the Variable Editor.
-
In the
Variable Editor:
- For Name, type YRVAL.
- In the Prompt
input field, type Please select a Year.
-
From
the Variable Type drop-down list, select Multiselect OR.
-
In the
Data Context area, select Values for field.
-
Click
the Select a field ellipsis button to get values
for the YEAR field. The Value Retrieval dialog box opens.
The Value Retrieval dialog box provides a list of available
fields in your data source. Double-click the YEAR field
to close the Value Retrieval dialog box and return to the Variable
Editor. The available values for the YEAR field are listed.
-
Double-click
each of the following values (2000, 2001, 2002)
to add them to the Accept List.
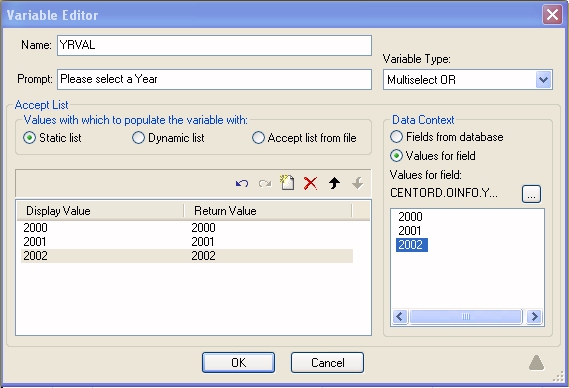
The following image shows the Variable Editor populated
with the values you selected.
-
Click OK to
close the Variable Editor.
-
Click OK to
close the Expression Builder.
-
Click OK to
close the Report Options dialog box.
x
Procedure: How to Create a Page Heading for the Report
Now
you will create a page heading for the report. Page headings appear
at the top of every report page.
-
In the
Report Painter window, place your cursor in the Page Heading area.
-
Double-click YEAR in
the Object Inspector Fields tab.
The embedded field <YEAR appears in the Page Heading area.
-
After
the <YEAR field, type Sales Metrics for All Products.
-
Press
the Enter key.
-
Type For
the followed by one space.
-
Double-click PLANTLNG in
the Object Inspector Fields tab.
-
Move the
cursor into the Page Heading area after <PLANTLNG and type Plant.
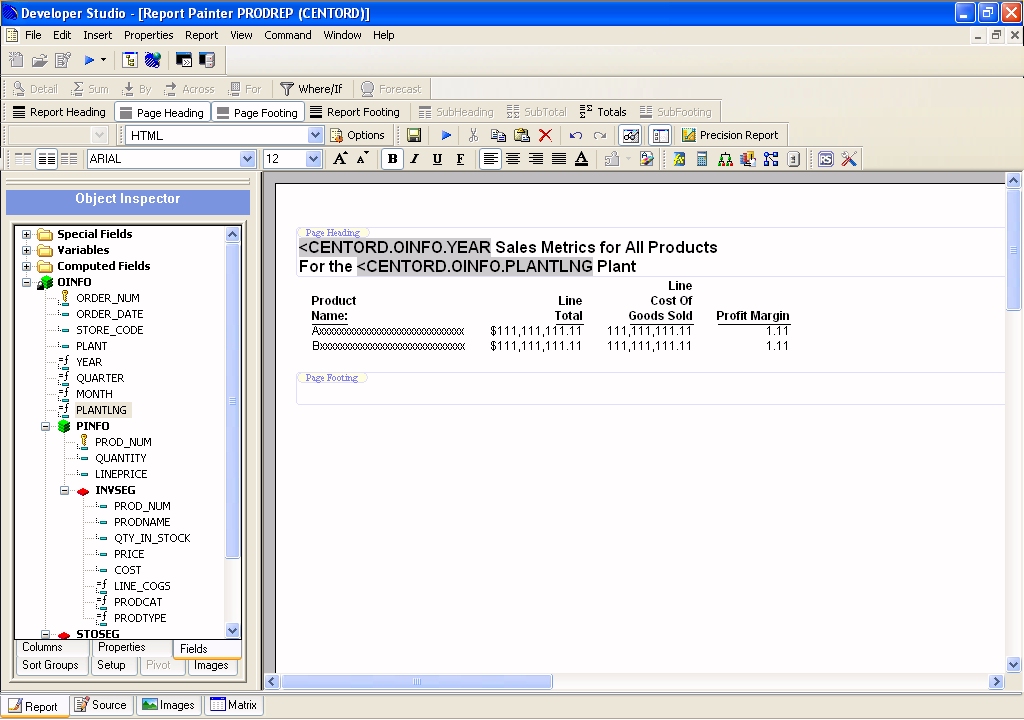
The following image shows how the report should appear
at this point.
-
Highlight
the second line of text in the heading.
-
From
the Font toolbar, select the following font attributes:
- For font type,
select Arial.
- For font style,
select Bold.
- For font size,
select 10.
-
Right-click
in the Page Heading area and select Options.
The Properties for Page Header dialog box opens.
-
Select
the Style tab, then click the Single
Color option in the Background Coloring section.
-
Click
the Select Colors button and choose a color
from the color palette.
-
Click
the Justification drop-down list and select Center.
-
Click OK to
close the Properties for Page Header dialog box.
x
Procedure: How to Style Your Report
You will now style the report by
adding alternating row colors to the report data and a border around
the heading.
-
From
the Report menu, select Styling.
-
Select Data from
the active object drop-down list.
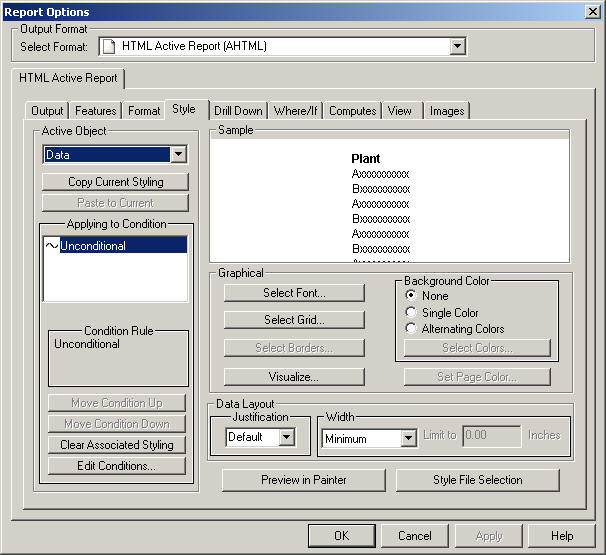
The following image shows the Report Options dialog box
populated with the values you selected.
-
In the
Background Color area, select the Alternating Colors option.
-
Click Select
Colors.
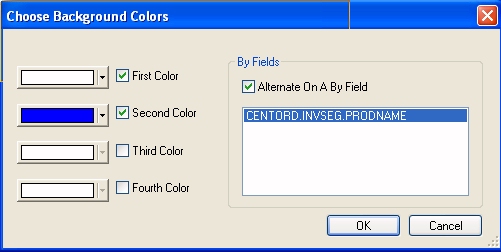
The Choose Background Colors dialog box opens.
-
Leave
the first color as the default selection of white.
-
Select
the Second Color check box and select the
second color.
-
Select
the Alternate On A By Field check box.
-
Select
the PRODNAME field.
The following image shows the Choose Background Colors
dialog box.
-
Click OK to
close the Choose Background Colors dialog box.
-
Click Apply to
apply your selection.
Leave the Report Options dialog box open to add a border
to the heading.
-
In the
Report Options dialog box, select Heading from
the active object drop-down list.
-
In the
Graphical area, click Select Borders.
-
Deselect
the Make all borders the same check box.
-
In the
Top Border area, select:
-
Medium for
width.
-
Dotted for
style.
-
Black for
color.
-
In the
Bottom Border area, select the Same as Top Border check
box.
-
In the
Left Border and Right Border areas, select OFF from
the Width drop-down lists.
The following image shows the Border dialog box populated
with the selected values.
-
Click OK to
close the Borders dialog box.
-
Click Apply in
the Report Options dialog box, then click OK.
x
Procedure: How to Set Up the Drill-Down Report
Now
you will set up this report so you can drill down from the data
in the Product Name column to the STORSAL graph you created earlier.
Drill down on the Product Name field, so the information you see
in the resulting graph will be specific to that product.
-
In the
Report Painter, right-click the Product Name column
and select Options.
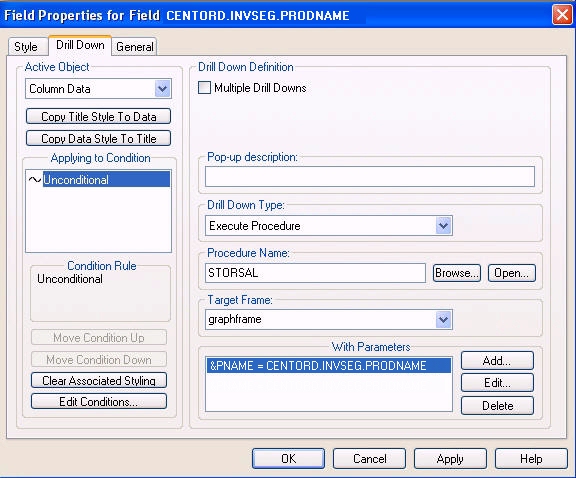
The Field Properties dialog box opens.
-
Click
the Drill Down tab.
-
In the
active object drop-down list, select Column Data.
-
In the
Drill Down Type drop-down list, select Execute Procedure.
-
Click
the Procedure Name Browse button, select STORSAL.fex from
the Open dialog box, and click Open.
-
In the
Target Frame area, type graphframe.
-
In the
With Parameters area, click Add.
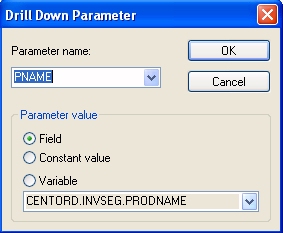
The Drill Down Parameter dialog box opens.
-
Type PNAME in
the Parameter Name input box.
PNAME is the parameter you created in the STORSAL procedure.
-
In the
Parameter value area, select the Field option.
-
Select
the PRODNAME field from the drop-down list
in the Parameter value area.
-
Click OK to
close the Drill Down Parameter dialog box.
The following image shows the Field Properties dialog box
populated with the values you selected.
-
Click OK to
close the Field Properties dialog box.
-
Select Close from
the File menu to close the Report Painter.
-
When
you are prompted to save your changes, click Yes.
You are returned to the HTML Composer and the New Parameters
dialog appears.
-
Click OK to
automatically add your parameters to the HTML page.
The following
image shows how the HTML Composer should look at this point.
x
Procedure: How to Customize Parameters
You
will now customize the Plant (LOCATION) parameter by modifying the
value from the data source to make it more user-friendly. You will
also change the control type for the Year (YRVAL) parameter from
a list box to a radio button, rearrange the order of values, and
change the default value.
-
In the
HTML Composer, select the Parameters tab.
The Properties and settings dialog box opens, showing a
Legend of the available controls for the parameters on the HTML
page.
-
Click
the list box control (Input control listbox1) associated
with the LOCATION parameter.
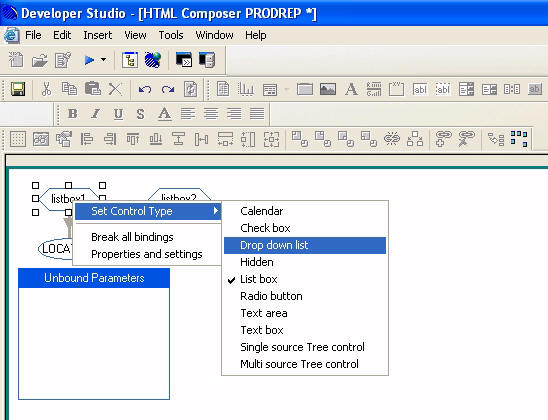
-
Change
the control type to a drop-down list box by right-clicking the LOCATION
list box control (Input control listbox1)
and select Drop down list from the Set Control
Type context menu.
-
From the
Properties and settings dialog box, double-click each of the values
in the Display column and type the full city name as indicated below:
- Change BOS
to Boston
- Change DAL
to Dallas
- Change LA to Los
Angeles
- Change ORL
to Orlando
- Change SEA
to Seattle
- Change STL
to St. Louis
This changes the
display name in the drop-down list from the value stored in the data
source to the values you specify.
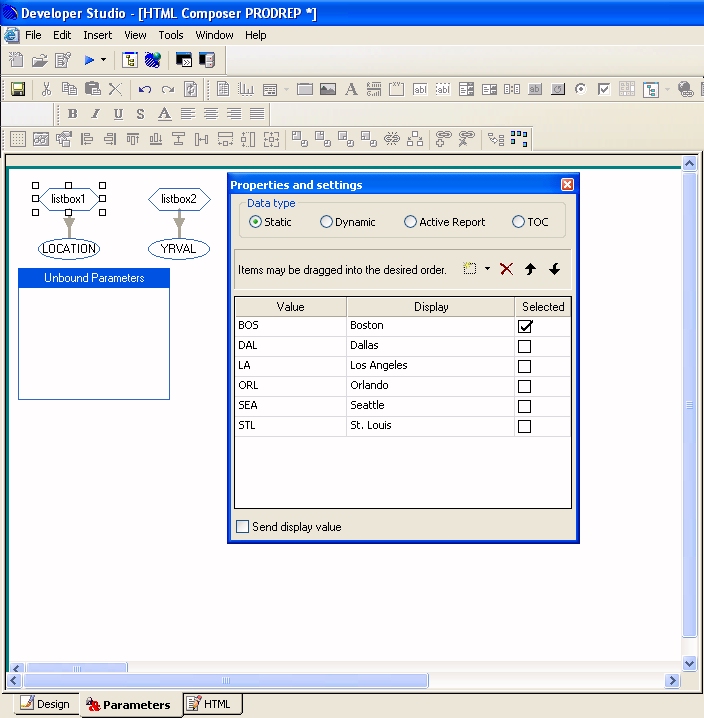
-
To make
Boston the default selection, click the Boston check
box in the Selected column.
The following image shows how the LOCATION drop-down list
settings should appear.
-
Click
the list box control (Input control listbox2) associated
with the YRVAL parameter.
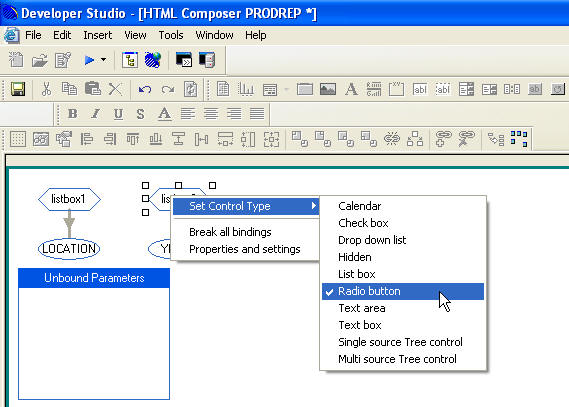
-
Change the control type to a Radio button by right-clicking
the YRVAL list box control (Input control listbox2)
and select Radio button from the Set Control
Type context menu.
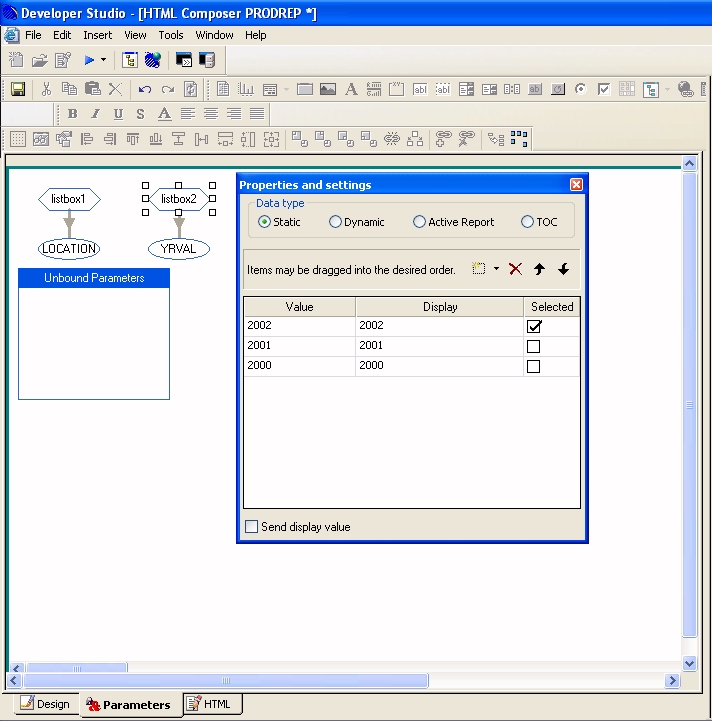
-
From the Properties and settings dialog
box, drag and drop the Year values so they appear in descending
order.
or
Select
a year and use the up/down arrows above the Static Values area to
change the order of the years.
-
To make
2002 the default selection, click the check box in the Selected column
for the 2002 value.
The following image shows how the YRVAL Radio button settings
should appear.
-
Close the Properties and settings dialog box for the YRVAL
Radio button.
-
Switch to the Design tab to view the
Parameter changes on the HTML page.
x
Procedure: How to Create the Target Frame For Drill-Down Output
You
will now add an output target frame that will contain the graph
output from the main report when a user selects a drill-down link.
The frame is invisible to the user until a drill-down link is selected.
-
In the
HTML Composer from the Insert menu, select Components,
then select Frame.
Your mouse pointer changes to crosshairs.
-
Scroll
down past the report placeholder to insert the frame by clicking and
dragging the crosshairs to form a rectangular box just below the
report area.
-
Click
anywhere inside the frame you inserted and view the Properties window.
The properties associated with the new frame are displayed
in the Properties window.
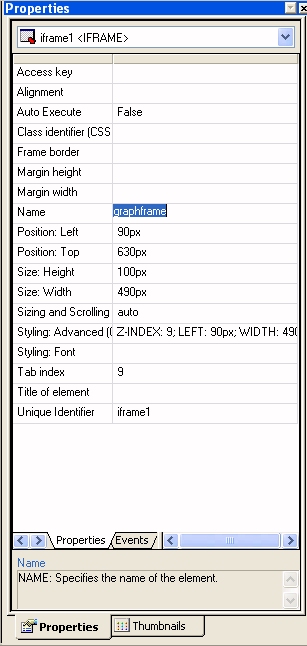
-
Double-click
the iframe1 value in the right column next
to Name in the left column of the Properties tab. Replace this value
by typing graphframe which is the same Target
Name entered in the Drill Down tab. See How to Set Up the Drill-Down Report.
The following image shows the Properties window with graphframe as
the new Name value.
x
Procedure: How to Reorganize the Layout and Add an Image
Now you will
move some items around in the HTML Composer and add an image.
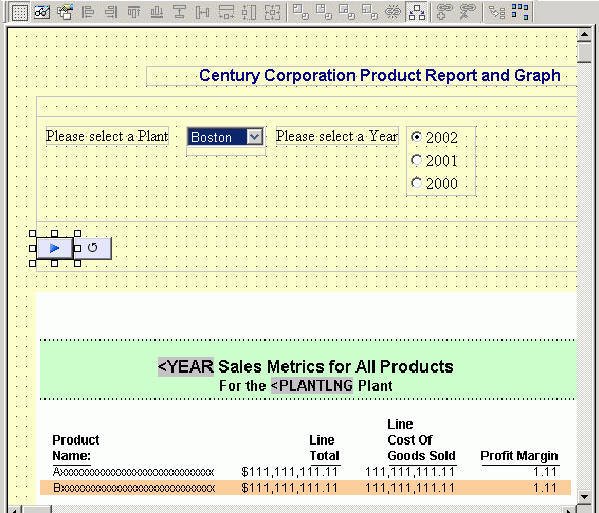
-
Rearrange
the heading, the Please select a Plant prompt
and selection box, and the Please select a Year prompt
and option buttons so the report page in the HTML Composer appears
like the following image.
-
Click
the new frame and grab the handles to resize it to almost the same
size as the report placeholder.
This frame will contain graph output when a user clicks
a drill-down link in the report.
-
Press
the Ctrl key and click the report placeholder and then the frame placeholder.
-
Click
the Make same size
 button.
-
Click
the Align right
 button.
-
Click
the Insert image
 button.
The cursor changes into a crosshair.
button.
The cursor changes into a crosshair.
-
Click and
drag the crosshair to create a rectangular image box below the bottom-left
corner of the new frame.
The Get source file dialog box opens.
-
Select
the following from the drop-down box:
-
Developer Studio Desktop
-
Window's Desktop
-
My Computer
-
Navigate
to the following directory (where install_dir is most likely the
C directory):
install_dir:\ibi\apps\ibinccen\images\powered.gif
-
Click Open.
The powered.gif image is added to your report layout.
-
Pressing
the Ctrl key, click the image and then the frame.
-
Click
the Relate Bottom Left
 button.
This ensures that the image always appears in relation
to the bottom-left corner of the frame, regardless of the size of
the frame.
-
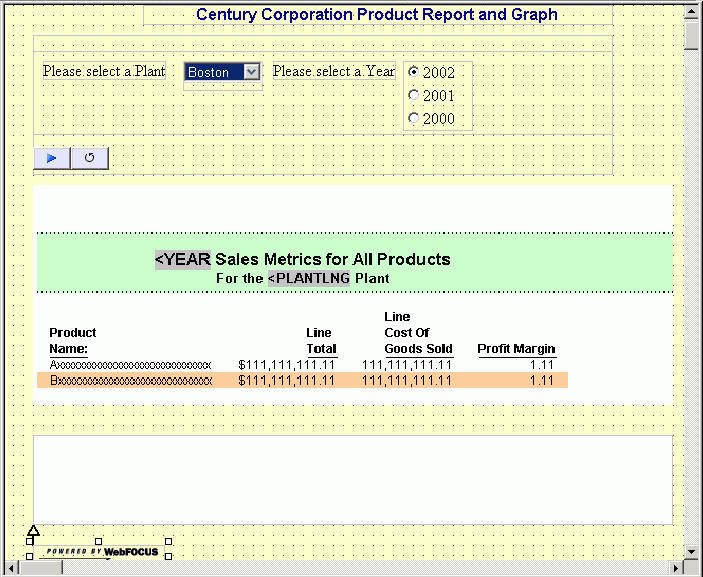
From
the File menu, select Save.
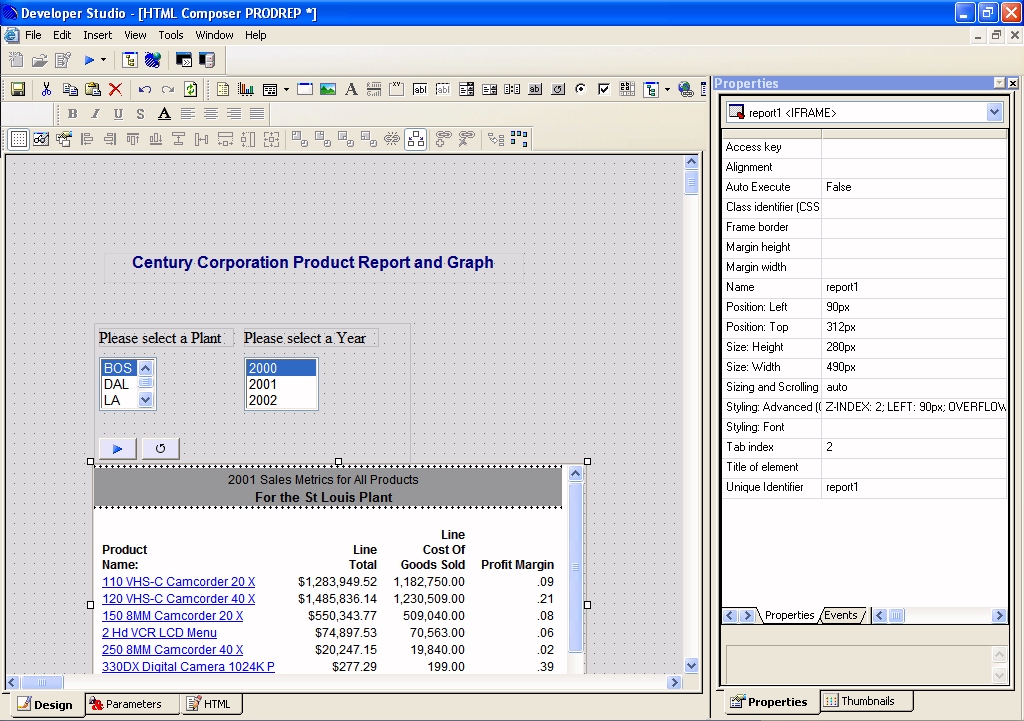
The following image shows the completed reporting application.
Your report layout will appear somewhat different depending on the
size and location of the components you added to the PRODREP.htm file.
-
From
the File menu, select Close.