By adding a drill down to a Google Map, you can filter a WebFOCUS report by the latitude and longitude coordinates of the selected marker(s). The parameter to pass the longitude/latitude values must be called &COORDINATES. This HTML Composer parameter will parse the Latitude and Longitude as paired data sets.
The following example updates a WebFOCUS report based on a Google Map location by:
- Joining Century Sales to the Locale data source.
- Creating a Revenue by Category report.
- Creating the &COORDINATES parameter in the report.
- Adding the report to the HTML Composer.
- Changing the Google Map properties to drill down to the embedded procedure.
-
From the HTML Composer with a Google Map created, select New
Report from the Insert menu.
The cursor changes into a crosshair.
- Click and drag the crosshair to create the report object and adjust it to the size you want.
-
Right-click on the report object and select Open
procedure viewer from the context menu.
The Procedure Viewer opens.
-
Join the Century Sales and Locale data sources.
Tip: The Century Sales and Locale data sources are available from the Master Files folder in the IBI Demonstration project of Developer Studio. You may copy these source files to the project directory of your choice.
-
Click and hold a component connector (yellow diamond) and select Join.
The Open dialog box appears.
-
Select centurysales.mas and click Open.
The Join dialog box opens.
-
Select the Add File button from the
Join toolbar.
The File Description List for the Join dialog box opens.
-
Select locale.mas and click Open.
Developer Studio automatically creates a Join between the data sources if they both have fields with the same formats. The Join tool displays both data sources and, the default Joins, as shown in the example image below.
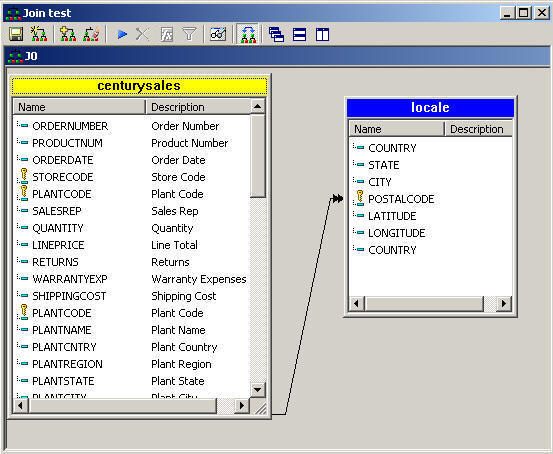
For more information about using the Join tool, see the Creating Reporting Applications With Developer Studio manual.
-
Close the Join tool to save the Join and update the procedure.
The Join is added to the Procedure Viewer.
-
Click and hold a component connector (yellow diamond) and select Join.
-
Create
a Revenue by Category report.
-
From the Procedure Viewer, click and hold a component connector
(yellow diamond) and select Report.
The Open dialog box appears.
-
Select centurysales.mas and click Open.
The Report Painter opens.
- Select By from the Columns toolbar and double-click CITY, PRODUCTTYPE, REGION, STATE, and STORENAME from the Object Inspector.
- Click the mouse after the STORENAME field to add the next field.
- Select Sum from the Columns toolbar and double-click LINEPRICE from the Object Inspector.
-
Rename the PRODUCTTYPE and LINEPRICE fields:
- Select PRODUCTTYPE, right-click and select Column Title from the context menu. Type Category in the Title dialog box and click OK.
- Select LINEPRICE, right-click and select Column Title from the context menu. Type Revenue in the Title dialog box and click OK.
- Type Revenue by Category in the Page Heading.
-
From the Procedure Viewer, click and hold a component connector
(yellow diamond) and select Report.
-
Create the &COORDINATES parameter in the report for the
WHERE clause.
-
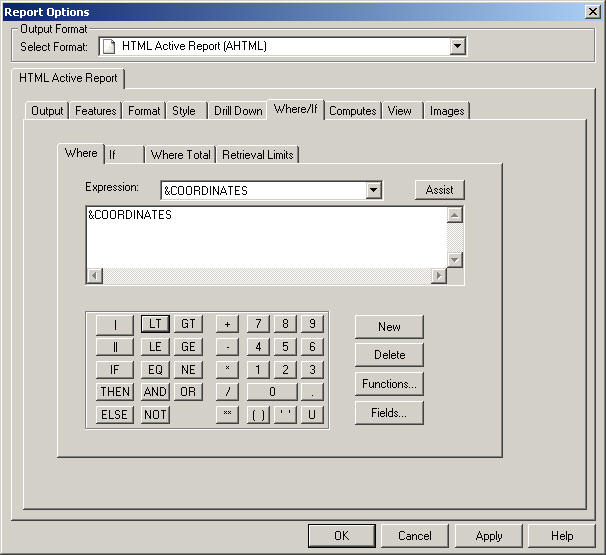
Select Where/If from the Report menu.
The Report Options dialog box opens at the Where tab.
-
Type &COORDINATES in the text area,
as shown in the example image below.
-
Click OK to close the Report Options dialog
box.
&COORDINATES is added to the Object Inspector in the Report Variables folder.
-
Select Where/If from the Report menu.
-
Add the report to the HTML Composer.
- The report and &COORDINATES parameter have been created, save and close the report. You are returned to the HTML Composer where the New Parameters dialog box appears.
-
Clear the Create control check box for the parameter, and click OK.
The parameters will be passed by the Google Map so you can delete the parameter dialogs here.
The Revenue by Category report appears in the HTML Composer.
- Select the report object to view the associated properties in the Properties window.
- Select False from the Auto Execute drop-down list in the Properties window.
-
Change
the Google Map properties to drill down to an embedded procedure.
-
Double-click the Google Map object to open the Map Properties
dialog box.
The Map Properties dialog box opens at the Map tab.
- Select the Layers tab.
- Click the mouse and hold the Shift key and select all markers.
-
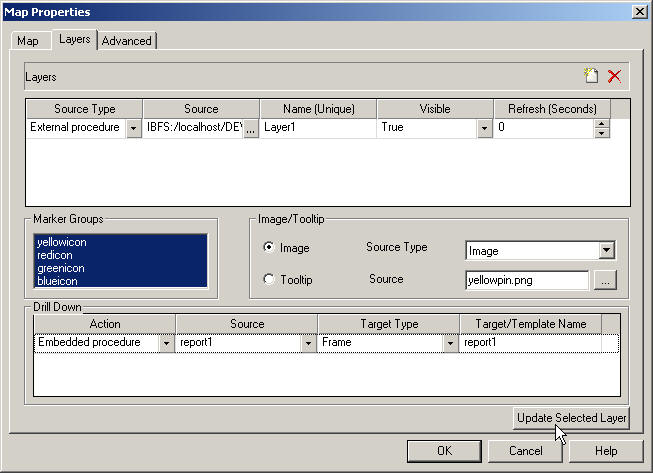
From the Drill Down section, select:
- Embedded procedure as the Drill Down Action.
- report1 from the Source drop-down list.
- Keep the default selections for Target Type and Target/Template Name.
-
Click Update Selected Layer.
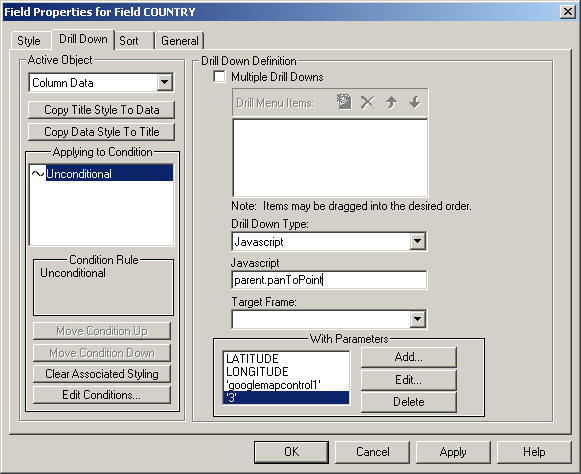
The following image is an example of the Map Properties dialog box with these drill-down options selected.
- Click OK to close the Map Properties dialog box.
-
Double-click the Google Map object to open the Map Properties
dialog box.
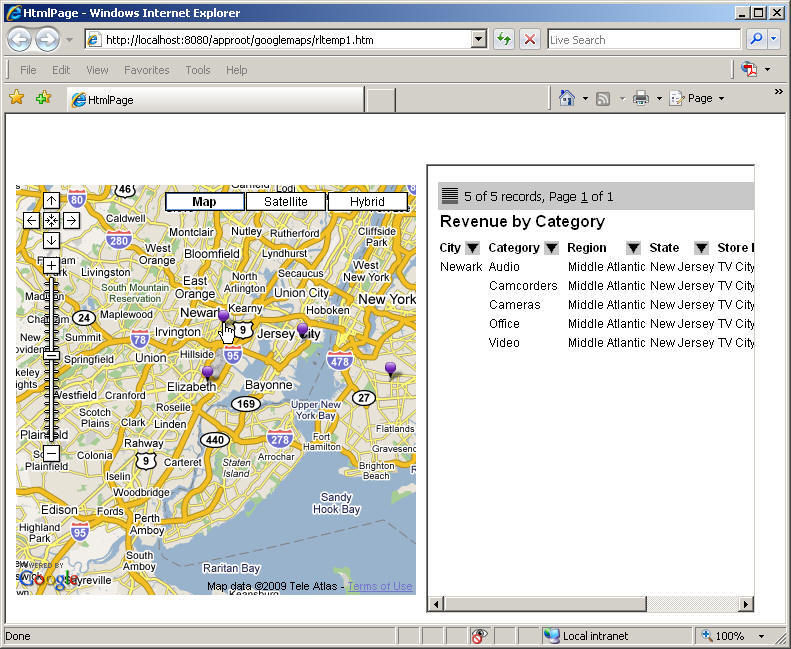
- Save and run the layout.
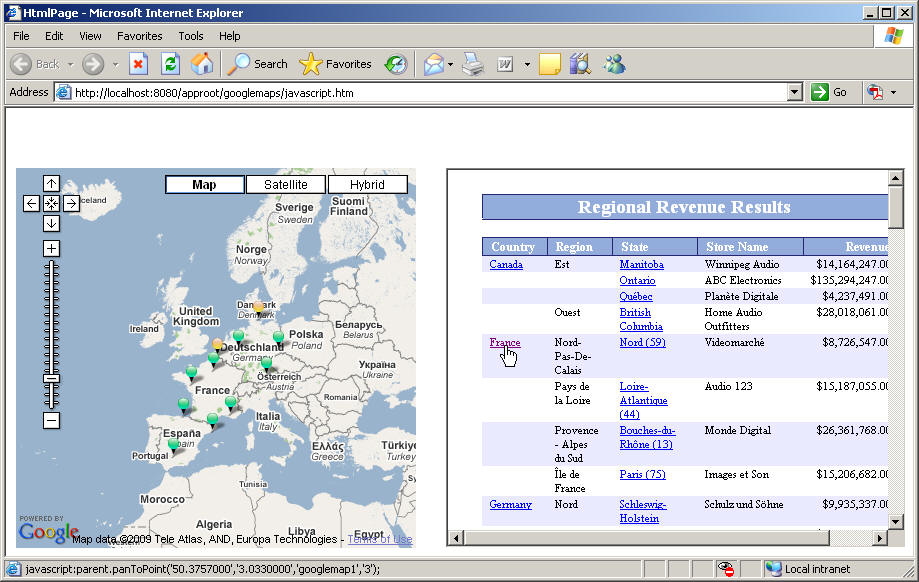
Click the markers on the Google Map to update the report based on the location selected, as shown in the image below.