The following apply when creating a RIA in the HTML Composer.
- If you use the Olive Rounded RIA theme and reference a parameterized report, the Schedule button is blank. The Schedule button displays correctly if you use other RIA themes.
- RIA only supports pixels for font size (Bindows limitation).
- For iframes, reports, and graphs, you will only see a border if you specify a width. By default, RIA gives the border a solid 1px border. If you want to specify a greater value, select Custom and give it a number in pixels (Bindows limitation).
- Overline is not supported in RIA (Bindows limitation).
- The following features
are not supported in RIA:
- Multi-Select Drop-Down List control
- Global Search and Paging control
- Making an ActiveX control a child of another control
- Undo/Redo option
- The RIA theme overrides any styling that has been applied to individual objects.
- If you have a CSS class referenced in a non-RIA page, when you convert to RIA, the CSS reference is removed from the HTML source and is replaced with the RIA CSS. This is because the RIA theme includes its own styling and will most probably require you to update your styling to go better with the RIA theme.
- When using a RIA-enabled page with an AHTML report, the Export as Procedure option is not available in the File menu.
- In migrating from
a non-RIA page to a RIA page, any JavaScript calls that go against the
controls cannot be in the window_onload function because the controls
are not available until the RIA framework completely loads in the
browser. This means that these JavaScript calls need to be moved
out of the window_onload function and placed in other functions
that get called after the page and RIA framework are loaded.
- Migrating a non-RIA
HTML page removes any custom styling. Applying a RIA theme provides
its own color scheme and styling. You may add custom styling after
converting the RIA page.
- RIA only supports integers and pixels when specifying a measurement for font size and border size.
- When adding existing objects from the canvas to a RIA window or accordion control, you may not just copy or move the object into the RIA parent component. Press and hold the Alt key, left-click, and drag the object into the RIA component to make it a child of the RIA component.
- If you are adding objects as children to any RIA control by using the Insert menu, draw the object in an open space on the canvas, press and hold the Alt key to drag that object to the parent object, and release the mouse.
- The location of accordion pages cannot be changed.
- To support RIA controls
in the HTML Composer, additional WebFOCUS StyleSheet
templates are available in the following tools: Report Painter, Report Assistant,
Graph Assistant, Advanced Graph Assistant, Power Painter,
and InfoAssist.
Note: The file extensions of the RIA StyleSheet templates vary, depending on the tool, but all appear as ria_stylesheet_theme.file extension, where the file extension is .txt or .sty. The available RIA StyleSheets are:
- ria_carbon_rounded_theme
- ria_dark_ocean_rounded_theme
- ria_ocean_rounded_theme
- ria_olive_rounded_theme
- ria_blue_theme
- ria_charcoal_theme
- ria_gray_theme
- ria_ruby_theme
- ria_turquoise_theme
Selecting one of these templates in your tool enables you to inherit the same RIA look and feel for the report or chart when the same RIA theme is applied in the HTML Composer. For more information on StyleSheets/Templates matching the look of a certain RIA theme, please see Matching RIA Themes and StyleSheets/Templates.
- Multiple vertical lines may appear across some RIA controls on the Design tab of the HTML Composer. For example, inserting an accordion control shows mulitple vertical lines through the accordion control page title toolbars. These lines are more visible when using darker RIA themes for your document. These multiple lines do not appear in the RIA page at run time.
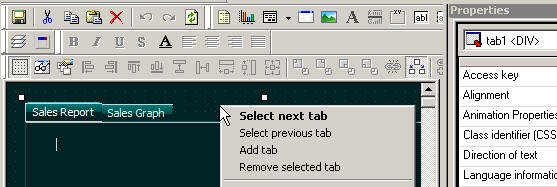
- When adding a Tab
Control to the layout as part of a RIA page, you can switch between
tabs on the Design tab of the HTML Composer. Double-click the
desired tab to switch between tabs or select the Tab Control, right-click,
and choose Select next tab or Select
previous tab from the context menu.
The following image shows a Tab Control on a RIA page with these options.
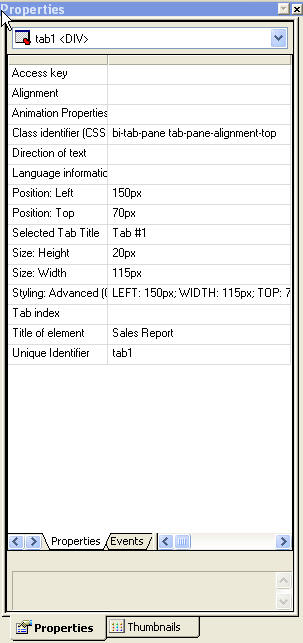
Note: You can change the text on a tab control by entering the text in the Title of element property field in the Properties window, as shown in the following image.
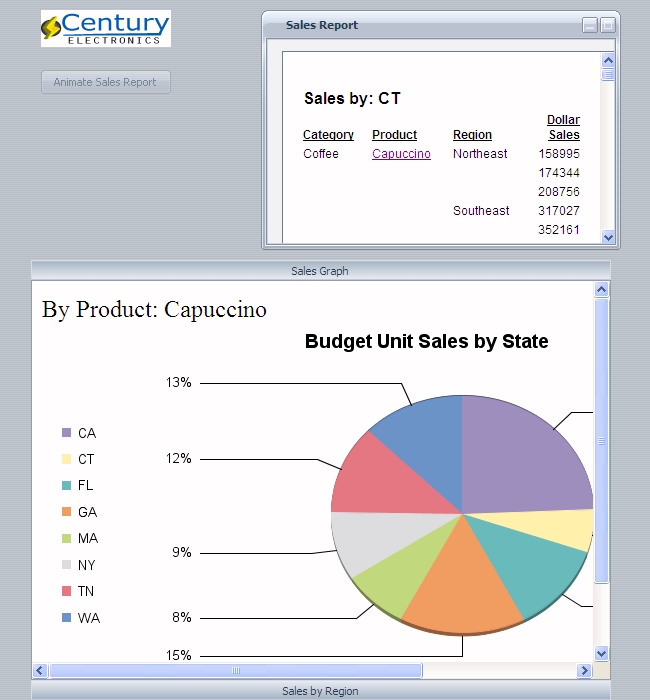
Suppose you want to create a RIA that shows:
- An image.
- A push button, that when clicked, animates the Sales Report window.
- An accordion control that shows a Sales Graph on one page.
- A report with controls to supply incoming parameter values on the Sales by Region page.
This example assumes that you are familiar with the basic Developer Studio features. The following example creates a RIA by:
- Creating a graph to be used in the RIA.
- Converting an existing HTML page to a RIA.
- Creating a RIA window component with a report that has drill downs.
- Adding a button that animates the RIA window.
- Creating a RIA accordion control that shows a frame on one page, and a report with chained controls on another page.
-
Create a graph to be used in the RIA.
Create the sales graph to be used as a target from a drill-down report in the RIA.
- Create a new procedure
in Developer Studio:
- With the Procedures
folder highlighted, select New/Procedure from
the File menu.
or
- Right-click the Procedures folder and select New/Procedure from the context menu.
The Add Procedure dialog box opens.
- With the Procedures
folder highlighted, select New/Procedure from
the File menu.
- Enter graphbyproduct as
the name for the new procedure in the File name field and click Open.
The Procedure Viewer opens.
- Click and hold a component connector (yellow diamond) and select Advanced Graph.
- Select the ggsales.mas Master
File and click Open.
Tip: The Gotham Grinds Sales data source (ggsales.mas) is available from the ibisamp Applications on localhost folder of Developer Studio. You may copy this source file to the project directory of your choice.
The Advanced Graph Assistant opens.
- Select Pie from
the Chart type subtab.
The available pie chart types appear.
- Select the Pie as
the type of Pie chart.
The Advanced Graph Assistant refreshes showing a sample pie chart.
- Click the Data selection subtab.
- Click and drag ST as the Pie slices and click and drag BUDUNITS as the Measures, in the Available Fields area.
- Select the Header ellipsis
button from the Chart Properties window and type By Product: and
double-click PRODUCT from the Field Tree
in the Heading window.
The heading appears as By Product: <GGSALES.SALES01.PRODUCT. Click Apply and OK to close the Heading window.
- Select the Filters folder from the Available Fields area and create the following parameter: WHERE PRODUCT EQUAL to Product Name.
- Click the Chart editor subtab and select Quick chart from the Chart folder.
- Type Budget Unit Sales by State in the Chart title field of the Quick chart properties window.
- Select Left from the Legend position drop-down list.
- Save and close the graph and Procedure Viewer.
- Create a new procedure
in Developer Studio:
-
Convert an existing HTML page to a RIA and add objects to the page.
- Create a copy of chaining_example.htm, that was created in Applying Conditions to a Chain of this manual, and rename it to ria_example.htm.
- Open ria_example.htm in the HTML Composer.
- Select DOCUMENT from
the Properties window drop-down list.
The available properties for the document object appear.
- Select Clean from
the RIA Theme drop-down list.
The RIA theme is applied to all components on the page and the RIA Components toolbar is added to the HTML Composer.
- Move the report and form control down the page, as we will use those components later.
- From the Insert menu,
select Components, then click Image.
The cursor changes into a crosshair. Click and drag the crosshair to create the image object and size, and select an image from the Get source file dialog box.
- Select Push button from the Components toolbar and drag it onto the Design canvas underneath the image.
- Rename the button
by selecting the Push button on the Design tab and double-click
in the field next to Value in the Properties
window.
Tip: The button object appears as button1<DIV> in the Properties window drop-down list.
- Type Animate Sales Report in the Value property field and press the Enter key.
- Click the Animation
Properties ellipsis button from the Properties window.
The Animation Properties dialog box opens.
- Select the Opacity Animator check box to enable the opacity settings.
- Select blink as
the Type, and leave the Control to activate as <Auto Start>.
This indicates that the blinking animation for the push button will start automatically in the RIA page.
- Click OK to close the Animation Properties dialog box.
-
Create and animate a RIA window component.
- Select the Window button from the RIA Components toolbar.
- Left-click and drag the window onto the Design canvas.
- Release the mouse and resize the object.
- Rename the window
by typing Sales Report in the Caption properties
field of the Properties window.
Tip: The RIA window component appears as window1<DIV> in the Properties window drop-down list.
- Select the Report button from the Components toolbar and drag it into the window object on the Design tab, release the mouse, and resize the report object within the window component.
- Double-click the
report object and select ggsales.mas
to open
the Report Painter.
Tip: The Gotham Grinds Sales data source (ggsales.mas) is available from the ibisamp Applications on localhost folder of Developer Studio. You may copy this source file to the project directory of your choice.
- Create the sales
report, with a drill down on the Product field, to be used in the RIA
window:
- Insert CATEGORY,PRODUCT, REGION, and ST as the By fields, hiding the ST field.
- Insert DOLLARS as the Sum field.
- Add Sales by: <GGSALES.SALES01.ST in the Page Heading.
- Select the Product field, right-click, and select Options to open the Field Properties dialog box.
- Select the Drill
Down tab to apply a drill down to the Product field
column data, that executes a procedure in a frame.
Select Column Data as the active object. Select Execute Procedure as the Drill Down Type. Select graphbyproduct.fex as the Procedure name (which we created in step 1 of this example). Enter iframe1 as the Target Frame location, which we will add later in the HTML Composer.
- Select Add from the With Parameters section of the Drill Down tab, and select PRODUCT from the Parameter name drop-down list. This is the parameter that we created in the graph. Leave Field as the Parameter value and select GGSALES.SALES01.PRODUCT from the drop-down list.
- Close and save the
report.
The drill down report appears in the RIA window component.
- Select the report component and set the Auto Fit property field to True in the Properties window.
- Select the RIA window
component on the Design tab and click the Animation Properties ellipsis
button from the Properties window.
Tip: The RIA window component appears as window1<DIV> in the Properties window drop-down list.
The Animation Properties dialog box opens.
- Select the Location Animator check box to enable the location settings.
- Select button1 from
the Control to activate the drop-down list.
This indicates that clicking the Push button will activate this window at run time.
- Type the From Position
Left value as 10.
This indicates that the location of the window will start the animation 10 pixels from the left position of the page when the window is animated.
- Click OK to close the Animation Properties dialog box.
-
Create a RIA accordion control component.
- Select the Accordion Control button from the RIA Components toolbar.
- Left-click and drag the accordion control onto the Design canvas underneath the RIA window component.
- Release the mouse and resize the object.
- Rename the selected
page of the accordion by typing Sales Graph in
the Selected Page Title properties field of the Properties window.
Tip: The RIA accordion control component appears as accordion1<DIV> in the Properties window drop-down list.
- Select the Frame
button from the Components toolbar and drag it into the accordion
object on the Design tab, release the mouse, and resize the frame
object within the accordion page.
Note: The frame component appears as iframe1<IFRAME> in the Properties window drop-down list. This is the name that we assigned as the Target Frame location for the drill-down report that appears in the RIA window.
- Select the Frame component and set the Auto Fit property field to True in the Properties window.
- Right-click the accordion
component and choose Select next page from
the context menu.
The next page in the accordion control is selected.
- Type Sales by Region in the Selected Page Title properties field of the Properties window.
- Scroll down the Design tab and select the existing report and form control by using the Shift key on your keyboard.
- Press and hold the
Alt key, drag the selected components onto the accordion page, and
release the mouse.
The report and form control are added within the Sales by Region accordion page. Resize the objects if necessary.
- Remove any unused pages from the accordion control by selecting and removing pages from the right-click context menu.
- Save and run the RIA.
The following image shows the RIA at run time.