- In a zoomed graph, select Data Scrolling from the Graph menu.
-
You can now either:
- Drag the solid
column that represents the zoomed data to view other data (other
columns are highlighted in red as you pan).
or
- Click subsequent sections of the thin highlighted bar ("handle") at the bottom of the graph. The zoomed data changes as you click each section.
- Drag the solid
column that represents the zoomed data to view other data (other
columns are highlighted in red as you pan).
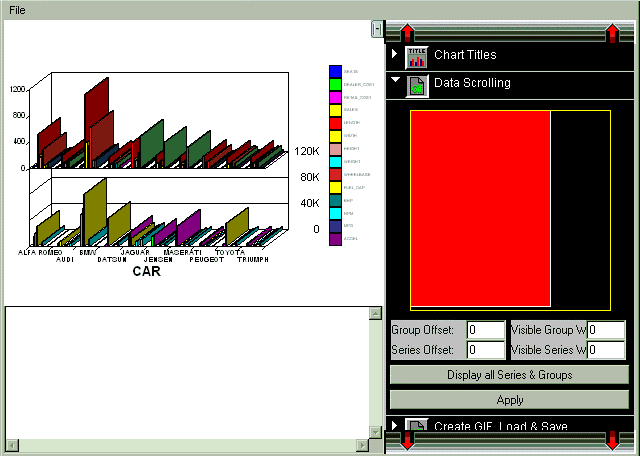
The following image shows a graph in its normal state (indicated by the solid rectangle under the Data Scrolling menu). In the graph, each data group (bar) represents one car.

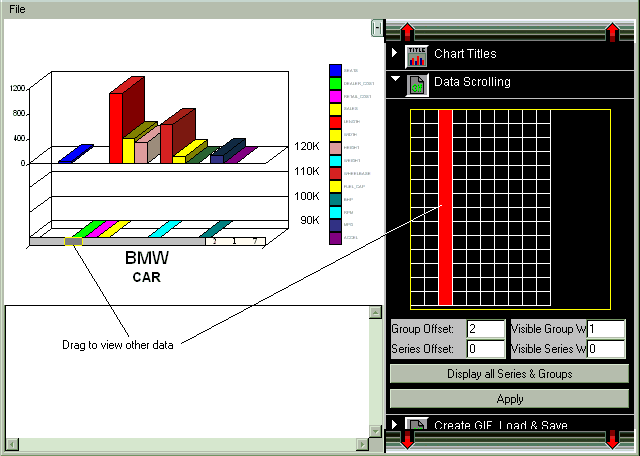
The next graph shows an enlarged area after zooming in on the bar for BMW. Notice that the large solid rectangle in the right panel now appears as a grid with only one solid column.

To pan across groups of data, with the graph in the zoomed state and Data Scrolling selected from the Graph menu, drag the solid column that represents the zoomed data to pan across all of your data.
or
Click the thin shaded bar at the bottom of the graph to view other areas of your graph in a zoomed state. Note that this method of panning is available when subsequently running the graph, provided that it was saved in its zoomed state.