Adding Chart Titles

How to:

You can add and edit the titles that appear with a chart or graph. You can edit the chart title, chart subtitle, chart footnote, and axis titles.


Top of page

x
Procedure: How to Define Chart Titles
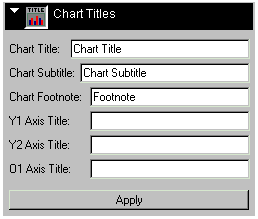
  1. From the Graph Editor, select Chart Titles. The following dialog box opens:

    Chart Titles dialog box

  2. Enter a title string in each field where you want to define title text. You can define the chart title, subtitle, footnote, and axis title strings. The number of axis titles (O1, O2, X1, Y2, and Y2) will be different depending on the Graph Type.
  3. Select the Apply button to display the title strings in the chart.

Top of page

x
Syntax: How to Add Properties and Methods for Chart Titles

The selections in this dialog add the following methods to the code that defines this chart:

Editor Field

Method

Chart Title

setTextString (getTitle(),"Title String");

Chart Subtitle

setTextString (getSubtitle(),"Subtitle String ");

Chart Footnote

setTextString (getFootnote (),"Footnote String ");

O1 Axis Title

setTextString (getO1AxisTitle(),"O1 Axis Title");

O2 Axis Title (where applicable)

setTextString (getO2AxisTitle(),"O2 Axis Title");

X1 Axis Title (where applicable)

setTextString (getX1AxisTitle(),"X1 Axis Title");

Y1 Axis Title

setTextString (getY1AxisTitle(),"Y1 Axis Title");

Y2 Axis Title

setTextString (getY2AxisTitle(),"Y2 Axis Title");

Note: If the default display attribute of a chart title is false, the setDisplay() method is added to the code to enable the display of the defined title object.

Example:

setDisplay(getO2Title(),true);
setDisplay(getO2Title(), false);

If you clear a title string, the setDisplay method will be added to the code to disable display of the cleared text object.

Example:

setDisplay(getO2Title(), false);

WebFOCUS