Applying Color and Line Options in Graphs
You can modify the color and line widths of objects
in your graphs. The Color and Line Setting dialog box includes different
tabs depending on the object in the chart that is selected. For
example, in a bar chart you can change the color of each bar, and
in a line graph you can change the color and width of the line representing
the data.
When an object with an interior is selected
(that is, riser or chart frame), you can choose:
- The fill color of objects.
- The line color
of objects.
When a line object is selected in a chart, you can change:
- The color of
objects.
- The line width.
x
Procedure: How to Select Color and Line Settings
-
From
the Graph Editor, select Color and Line Options.
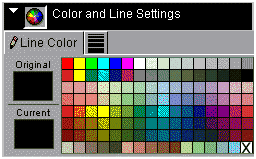
The following dialog box appears:

-
To change
the color of any object in the chart, select an object, then select
a color from the grid. The change occurs immediately.
-
To change
the width of a line object, use the Line Width slider bar on the
Line tab to adjust the width. A value of zero selects a line width
of one pixel. Values greater than zero specify the relative width
of the line in pixels depending on the applet size. Click the Apply button
to assign the width to the line.
x
Syntax: How to Add Methods for Color Settings
Selections
in the associated dialog box add the following methods to the code
that describes this graph.
If
a line object is selected:
setBorderColor ( aGetObjectIDMethod(), new Color ( value, value,
value ));
If
an object with an interior is selected:
setFillColor ( aGetObjectIDMethod(),new Color(value,value,value));
For
example:
setFillColor( getCubeFloor(),new Color(192,192,192));
Note: The
aGetObjectIDMethod() is not a Graph Editor method. It is a notation
convention used in this document to indicate one of the methods
that returns an object ID. The Editor chooses the appropriate method
based on the object that is selected in the chart. For example,
the getO1Label() method is used if the O1 Axis Label is selected
in the chart.
x
Syntax: How to Add a Method for Line Width
Selections
in the associated dialog box add a setLineWidth() method to the
code that describes this graph:
setLineWidth ( aGetObjectIDMethod(),value);
setLineWidth ( getY1ZeroLine(), 2 );
For
example:
setLineWidth ( getY1ZeroLine(), 2 );
Note: The
aGetObjectIDMethod() is not a Graph Editor method. It is a notation
convention used in this document to indicate one of the methods
that returns an object ID. The Editor chooses the appropriate method
based on the object that is selected in the chart. For example,
the getO1Label() method is used if the O1 Axis Label is selected
in the chart.
