Running, Saving, and Printing a Graph
In this section: How to: Reference: |
The following topics provide detailed instructions for
running, saving, and printing graphs. The options listed below,
are available from all areas of the Advanced Graph Assistant.
Save/Save As. Click the Save icon
to save your graph. Select Save As from the
drop-down menu to the right of the save icon to open the save dialog
box. Note that Save As is not available in Advanced Graph Assistant
when accessed from Developer Studio.
Run/Run Debug. Click the Run icon
to run your graph. Select Run Debug from
the drop-down menu to the right of the run icon to run your graph
in debug mode. This turns on tracing and enables you to view the
generated graph syntax.
Preview. Click the Preview icon
to view the current graph in the preview area. You can also select
additional options from the drop-down menu to the right of the preview
icon including Refresh, Sample data, Live data, Show drop targets, and
Live data properties.
Help. Click the Help icon to access
help about the area of Advanced Graph Assistant in which you are
working. Select About from the drop-down menu to the right of the
help icon to open a window describing the version of the Advanced Graph
Assistant in which you are working.
Quit. Click the Quit icon to exit
Advanced Graph Assistant.
x
Procedure: How to Save a New Graph
Perform
these steps the first time you Save a graph you are creating.
-
Click
the Save button near the top-left corner
of Advanced Graph Assistant.
The drop-down list to the right of the Save button presents
two choices, Save and Save As, both of which perform the same function
the first time you save a graph.
-
Enter
a name for the graph.
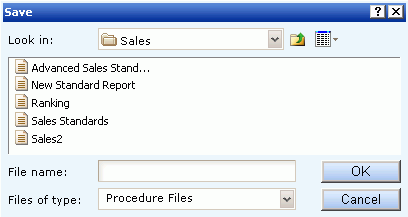
The first time you Save a graph (and when you select the
Save As option), a Save dialog box opens where you can specify the
directory and file name to save the graph. The default location
is the current Domain and folder, where you can navigate to another
directory to save the graph, if desired.
The following locations
are not available to save the graph: Shared Reports, Import Directory,
and Reporting Objects.
-
Click OK and
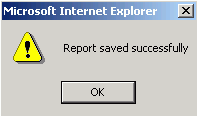
the following Report saved successfully confirmation message appears:

x
Procedure: How to Save an Existing Graph
Perform
these steps whenever you want to Save an existing graph you are
editing.
-
Click
the Save button near the top-left corner
of Advanced Graph Assistant.
Clicking Save automatically saves the edits to the current
graph file. You are not prompted to provide a name for the graph.
-
The
Report saved successfully confirmation message appears.
x
Procedure: How to Use 'Save As' to Save an Existing Graph
Save,
not Save As, is the default if you just click the Save button. Perform
the following steps whenever you edit an existing graph and want
to save it with a different name, save it to a new directory, or
both.
-
Click the down arrow to open the drop-down
list to the right of the Save button, which is located near the
top-left corner of Advanced Graph Assistant.
-
Select
the Save As option in the drop-down list.
The Save dialog box appears, as shown in the following
image.

-
Enter
a new name to save the graph.
The default location for Save As is the current Domain
and folder, where you can navigate to another directory to save
the graph, if desired.
The following locations are not available
to save the graph: Shared Reports, Import Directory, and Reporting
Objects.
Note: Save As is not available in Advanced
Graph Assistant when accessed from Developer Studio.
x
Procedure: How to Save a Graph to a File
-
Open
the procedure that contains the graph and add the following before
the Graph:
-
Open
the graph with Advanced Graph Assistant, select the Data selection
tab, then select the Available Fields tab.
-
Click
the Chart
 icon
in the query pane below the Available Fields tab.
or
Click anywhere on the chart displayed in the graph
preview area.
The Chart Properties form is displayed below
the graph preview area.
-
Click
the Value column in the row that displays Output
destination in the Property column. A drop-down arrow appears at
the far right edge of the row in the Value column.
-
Click
the down arrow to open the drop-down list.
-
Select File.
-
Double-click
the Value column in the row that displays
Name in the Property column. (This is a new row near the top of
the Chart Properties form that appears when the default Output destination
is changed from Screen to File.)
-
Type
a file name for the graph.
-
Click
the Value column in the row that displays Format in the Property column.
A drop-down arrow appears at the far right edge of the row in the
Value column.
-
Click
the down arrow to open the drop-down list.
-
Select
either PNG, JPEG, GIF,
or SVG from the format drop-down list. The
default is PNG.
-
Click Run. The
graph is saved to the file you specified in Step 1 of this procedure.
You can open your output file by selecting Open from
the File menu in your browser.
Note: When
saving a graph, if the graph contains a second horizontal category
(which is a horizontal field that produces multiple graphs), the
value in the FOCUS HEADING is not saved as part of the image file.
Instead, the horizontal field name is embedded in the graph page
heading to identify the graph.
x
Reference: Saving Options
When
you click the Save or Save As buttons you save your report (procedure).
If you make changes in your report without subsequently saving them
and then click Quit, you are prompted with the following options:
-
Yes. Click
to save your changes and exit the report.
-
No. Click
to discard your changes and exit the report.
-
Cancel. Click
to return to your report to continue working or use Save or Save
As to save your changes and then click Quit to exit your report.
Note: In
Advanced Graph Assistant, if you close the window by clicking the
X, your changes will not be saved.
x
Procedure: How to Run a Graph
-
Create
a graph.
-
Click
the Run button near the top-left corner of Advanced
Graph Assistant to view the output of the graph.
x
Procedure: How to Print a Graph
-
Run
a graph.
-
Right-click
anywhere in the browser that opens to display the graph, and select Print from
the pop-up menu.
x
Procedure: How to Send Graph Output Directly to a Printer
-
Make
sure the Data selection tab and the Available Fields tab are selected.
-
Click
anywhere on the chart displayed in the graph preview area.
or
Click the Chart
 icon
in the query pane below the Available Fields tab.
The Chart
Properties form is displayed below the graph preview area.
-
Click the Value column
in the row that displays Output destination in the Property column.
A drop-down
arrow appears at the far right edge of the row in the Value column.
-
Click
the down arrow to open the drop-down list.
-
Select Printer.
-
Click Run.
The graph prints to your default printer setting.
x
Reference: Choosing Formats for Output to the Screen, a File, or Printer
When
you create or edit a graph in Advanced Graph Assistant, you can
select to send the graph output to the screen, a file, or a printer.
If you
are selecting the output destination to be the screen or a file,
all options listed in Graph Display Formats are available.
If you are selecting the output
destination to be a printer, only the PNG, GIF, and SVG options
are available.
x
Following are descriptions of the graph display formats:
-
PNG (Portable Network Graphics). PNG
graphs are bitmapped and can support 16 million colors. In addition,
PNG graphs have less compression (data is decompressed 100% back
to the original). Therefore, saving, altering, and resaving a PNG
does not degrade its overall quality. The PNG graph appears in the
browser.
-
JPEG (Joint Photographic Experts Group). A
compressed file format.
-
GIF (Graphics Interchange Format). GIF
compresses well but only supports 256 colors. The GIF graph appears
in the browser.
-
SVG (Scalable Vector Graphics). SVG
is a text-based graph file format that enables Web application developers
to design powerful, interactive graphs. SVG is compact and generates
high quality images on any media regardless of resolution. The SVG
is viewable with an Adobe plug-in.


 icon
in the query pane below the Available Fields tab.