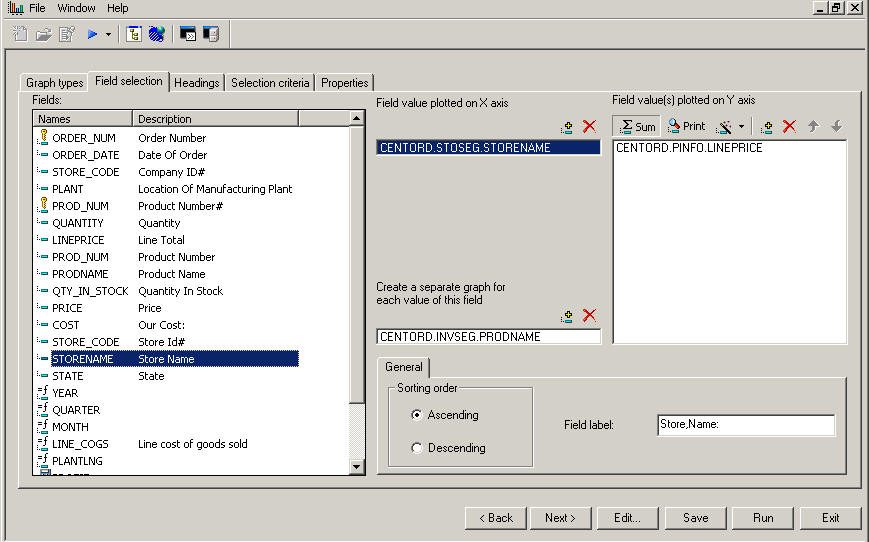
The following image shows the Field Selection tab in the Graph
Assistant.
x
Reference: Field Selection Tab: Display Tab and Visualize Tab for Y-Axis
The following
image shows the Display subtab for the Y-axis field name in the
Field Selection tab.
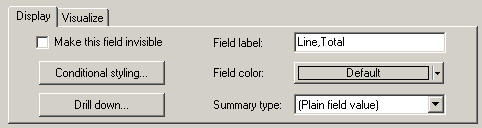
For
the Y-axis field name Display subtab:
-
Make this field invisible
- Check to temporarily hide the display of a Y-axis field.
-
Conditional Styling
- Click to open the conditional styling dialog box shown in
the following image which you use to add conditional styling in
a graph.
-
Field label
- Lists the highlighted field selected from the Y-axis.
-
Field Color
- Select the display color for the field currently selected
in the Y-axis value list.
-
Summary Type
- Select a summary type for the Y-axis field selected in the
Y-axis value(s) list.
The following image
shows the Visualize subtab for the Y-axis field name in the Field Selection
tab.
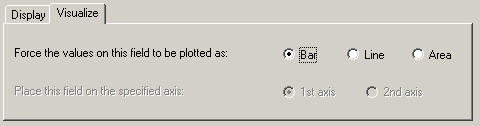
For the Y-axis
field name Visualize subtab:
-
Force the values of this field to be plotted in the following manner
- Choose bar, line, or area.
-
Place this field on the specified axis
- Choose 1st axis or 2nd axis, for dual-axis graph types.
x
Reference: Field Selection Tab: General Tab for X-Axis
The
following image shows the General subtab for the X-axis field name
in the Field Selection tab.
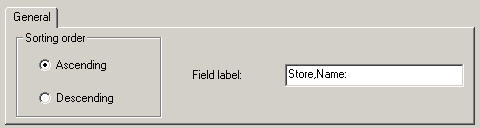
For
the X-axis field name:
-
Sorting order
- Click ascending or descending.
-
X-axis field label
- Field name is entered.
x
Reference: Field Selection Tab: General Tab for Separate Graph
The
following image shows the General subtab for the Separate Graph
field name in the Field Selection tab.
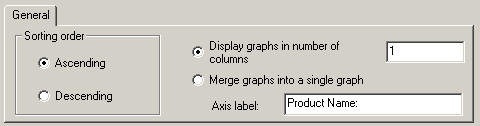
For
any additional graph field name(s):
-
Sorting order
- Click ascending or descending.
-
Display graphs in number of columns
- Enter a number in the text box.
-
Merge graphs into a single graph
- Click this option button to activate.
-
Axis label
- The field name is automatically entered in this text box.