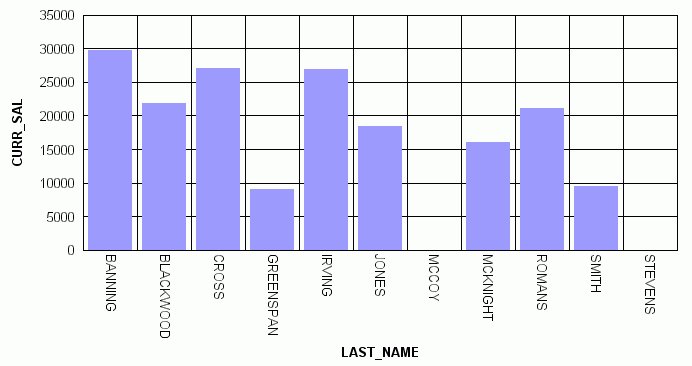
The following image illustrates how missing values are represented in a bar graph when designated to appear as zero. The CURR_SAL values for McCoy and Stevens are missing.

How to: Reference: |
You can display missing data values (in a bar graph, line graph, area graph, or any variation of these graph types) in one of the following formats:
The following image illustrates how missing values are represented in a bar graph when designated to appear as zero. The CURR_SAL values for McCoy and Stevens are missing.

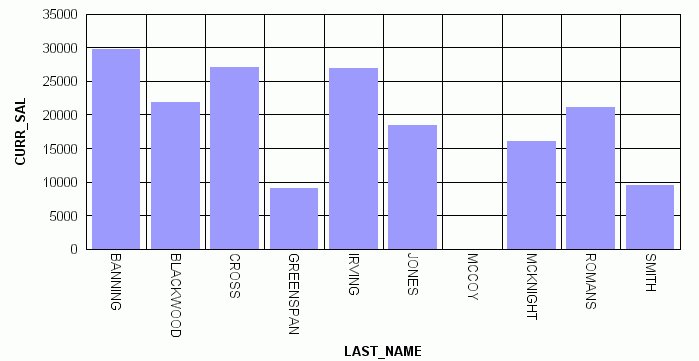
The following image illustrates how missing values are represented in a bar graph when designated to appear as a gap. The CURR_SAL value for McCoy is missing.

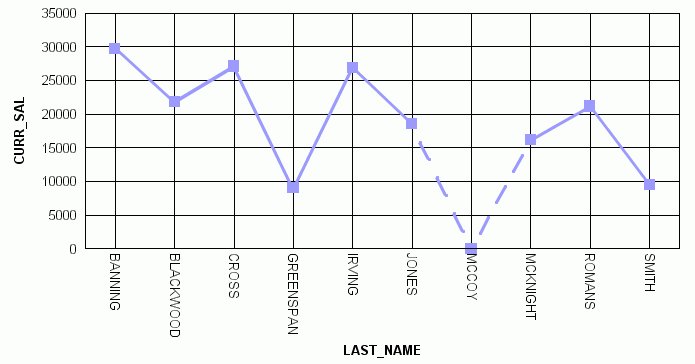
The following image illustrates how missing values are represented in a line graph when designated to appear as a dotted line to zero. The CURR_SAL value for McCoy is missing.

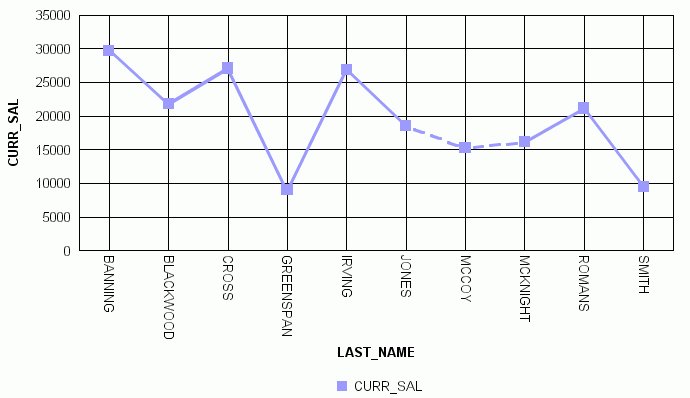
The following image illustrates how missing values are represented in a line graph when designated to appear as an interpolated dotted line. The CURR_SAL value for McCoy is missing.

| WebFOCUS |