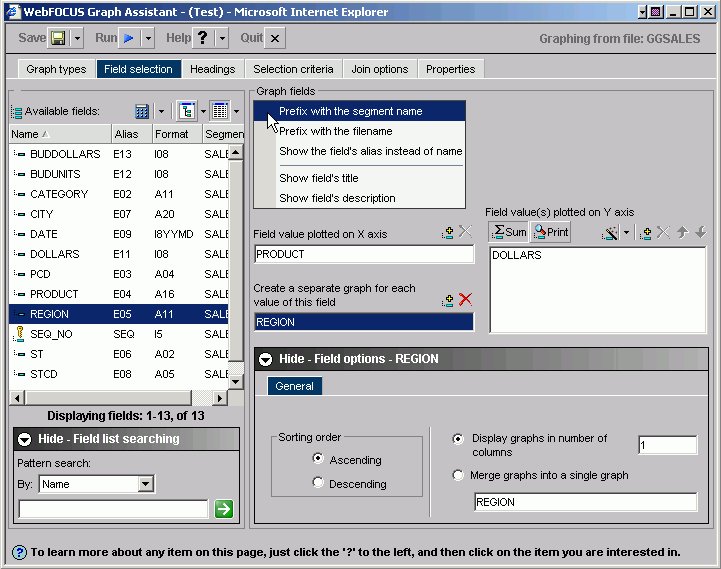
The Field selection tab, shown in the following image, is used
to choose the fields you want to use in a graph.
x
Reference: Field Selection Tab: Available Fields
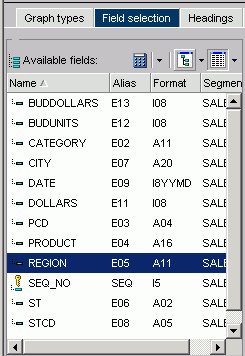
The following image shows the Available
fields area of the Field selection tab. The Available fields area
in the Field selection tab, as shown in the following image, provides
the following functionalities and options for selecting available
fields in a graph.
-
Available fields
- Displays a list of field names from the selected data source. x
x
-
Define button
- Click the Define button to select from New define field,
Edit define field, or Delete define field. If you select the New
define field or Edit define field, the Define field creator dialog
box opens where you can create or edit a defined field. For more information,
see Field Selection Tab: Field Creator Dialog Box. x
-
Tree button
- When this button is selected, field names are displayed in
a tree structure. Optionally, data can be displayed in different
ways by clicking the adjacent down-arrow to open a drop-down list
that provides options to Show name, Show alias, Show title, or Show
description. The Show Field Tree display type is the default value,
and for some database structures, the Show Dimension Tree option
can be selected. x
-
List icon
- This button is selected by default to display a list of all
field names. Additional related information can be displayed by
clicking the adjacent down-arrow to open a drop-down list that provides
options to display Name, Alias, Title, Format, Description, Segment,
and Filename. You can also choose the option to Sort by file order.
x
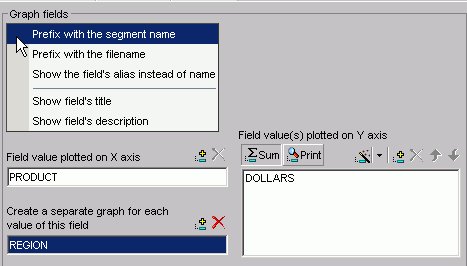
Reference: Field Selection Tab: Graph Fields
The
Graph fields area in the Field selection tab, as shown in the following
image, provides the following functionalities, including many options,
for selecting and displaying fields in a graph.
 x
x
x
x
x
x
x
x
-
You can view the selected fields with the following options:
-
Prefix with the segment name prefixes the selected
fields with the segment name.
Prefix with the filename prefixes
the selected fields with the name of the data source.
Show the field's alias instead of name displays
the aliases defined in the Master File instead of the field names.
Show field's title displays
the titles defined in the Master File instead of the field names.
Show field’s description displays
the descriptions defined in the Master File instead of the field
names.
x
-
Field Value Plotted on X axis
- Displays the horizontal (X-axis) field that was selected
from the Available fields area. x
-
Add button
- Adds a field to the X-axis. x
-
Remove button
- Removes a field from the X-axis. x
-
Create a separate graph for each value of this field
- Displays the second horizontal (X-axis) field (formerly referred
to as an Across field) that was selected from the Available fields
area. x
-
Add button
- Adds a second field to the X-axis. x
-
Remove button
- Removes a field from the X-axis.
-
Field value(s) plotted on Y axis
- Displays the vertical (Y-axis) field that has been selected
from the Available fields area.
x
-
Sum
- Creates a graph that aggregates data by the X-axis field.
This is the default.
x
-
Print
- Creates a graph that plots each Y-axis field value on a record-by-record
basis. If the selected X-axis value is numeric, a scatter graph
is generated. If the selected X-axis value is alphanumeric, a line
graph is generated.
x
-
New computed field button
- Opens the Computed Field Creator dialog box where you can
define the parameters for a new computed field. You can also click
the adjacent down-arrow to open a drop-down list to select the Edit
computed field option. For more information, see Field Selection Tab: Field Creator Dialog Box. x
-
Add button
- Adds a field to the Y-axis. x
-
Remove button
- Removes a field from the Y-axis. x
x
-
Move Up or Move Down buttons
- Moves the position of the field within the graph. x
x
x
Reference: Field Selection Tab: Field Options
Below
the Graph fields area in the Field selection tab is the Field options
panel you can display by clicking Show - Field options or
hide by clicking Hide - Field options. A
different Field options panel is displayed depending on whether
you have a Y-axis, X-axis, or secondary X-axis field selected in
the Graph fields area.
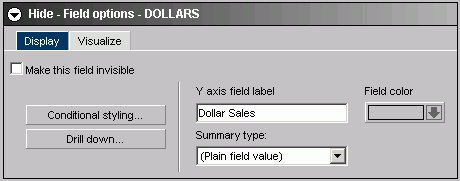
For the Y-axis Field options Display tab:
The
Display tab appears by default when the Field options panel is displayed
for Y-axis fields and provides the buttons, fields, and options
described after the following image.
 x
x
-
Make this field invisible
- Check to temporarily hide the display of the selected Y-axis
field. x
-
Y axis field label
- The selected Y-axis field name is automatically displayed.
You can edit this field to display a different label for the Y-axis
field.
x
-
Summary Type
- Select a summary type for the selected Y-axis field. The
choices are: Plain field value, Average Square, Average, Count,
Distinct, Show first in group, Show last in group, Maximum, Minimum,
Percentage, Count Percentage, Row Percentage, Sum, and Total. x
-
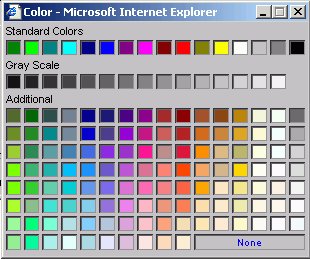
Field Color
- Select to open a pop-up color palette where you can select
the display color for the selected Y-axis field as shown in the
following image.
-
Conditional Styling button
- Click to open the conditional styling dialog box, as shown
in the following image, which you can use to add conditional styling
in a graph.

x
-
OK
- Returns to the Field selection tab after the conditional
styling is added to the graph.
x
-
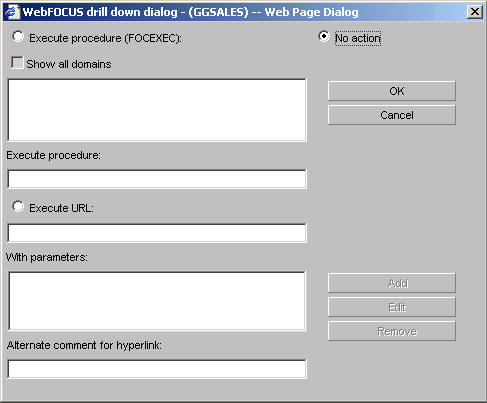
Drill Down
- Click to
open the drill down dialog box, which provides the fields and options listed
after the following image, that you can use to add drill down capability
to a graph.
-
No action
- This option is selected by default. (No procedure will be
executed.)
-
Execute procedure (FOCEXEC)
- Select this
option to access procedures in the Standard Reports folder of the default
domain. Click the procedure you want to execute.
-
Show all domains
- When Execute procedure (FOCEXEC) is selected, click this
check box to gain access to procedures in the Standard Reports folders
of all available domains.
-
Execute procedure
- The procedure you selected appears in this text box.
-
Execute URL
- Select this
option to enter the URL you want to execute.
-
With parameters
- When a parameter is created, it is automatically added to
this list box.
-
Alternate comment for hyperlink
- Type text here to display in place of the hyperlink specified
in the Execute URL field.
-
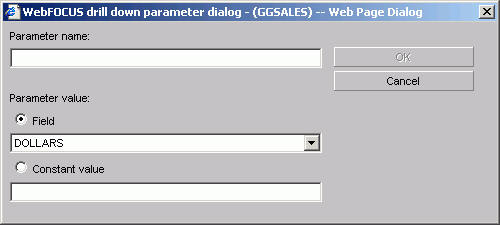
Add button
- Click to
open the drill-down parameter dialog box, which provides the fields and
options listed after the following image.
-
Parameter name
- Enter the parameter name you created in the drill-down procedure.
-
Parameter value: Field
- The parameter will be set to the corresponding value of the
object the user drills down on in the specified field.
-
Parameter value: Constant value
- The parameter is set to the specified value.
-
OK button
- Returns to the drill down dialog
box. The parameter is added to the With parameters list box. x
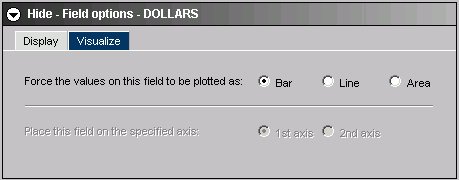
For the Y-axis Field options Visualize tab:
The
Visualize tab appears when the Field options panel is displayed
for an X-axis field and provides the options described after the
following image.
x
 x
x
-
Force the values of this field to be plotted as:
- Choose Bar, Line, or Area. x
-
Place this field on the specified axis
- You can choose first axis or second axis. (Available for
dual axis graph types only.)
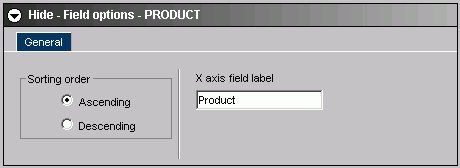
For the X-axis Field options:
The
General tab appears when the Field options panel is displayed for
an X-axis field. It provides the fields and options described after
the following image.
x
 x
x
-
Sorting order
- Click Ascending or Descending. x
-
X-axis field label
- The X-axis field name is automatically displayed. You can
edit this field to display a different label for the X-axis field.
For the Secondary X-axis (Across) Field options:
The
General tab appears when the Field options panel is displayed for
a second X-axis (Across) field and provides the fields and options
described after the following image.
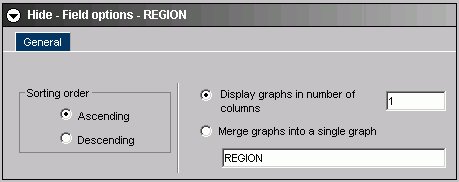
-
Sorting order
- Click Ascending or Descending. x
-
Display graphs in number of columns
- Enter a number in the text box.
-
Merge graphs into a single graph
- Click this option button to activate merge functionality.
-
Axis label
- The selected field name is automatically displayed. You can
edit this field to display a different label for this Across field.
x
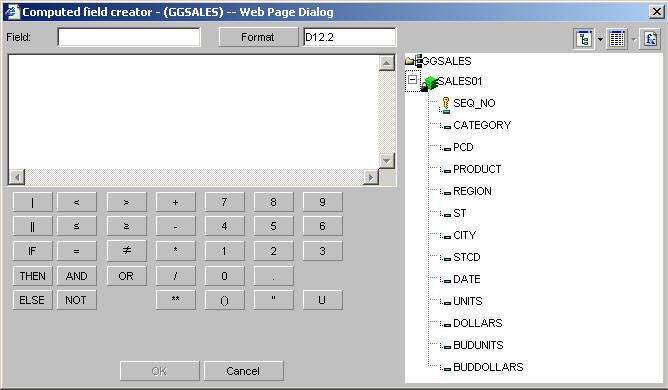
Reference: Field Selection Tab: Field Creator Dialog Box
Use
the Field Creator dialog box to create or edit Defined and Computed
fields, as shown in the following image.
-
Field
- Enter a name for the computed or defined field.
-
Format
- Click to display the Change Format
dialog box, as shown in the following image.
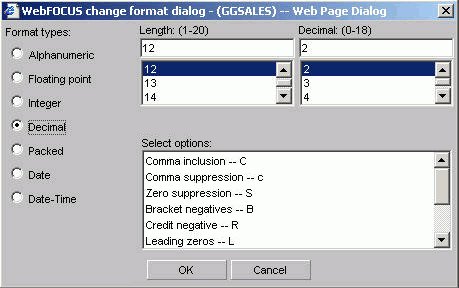
-
Format types
- Choose:
- Alphanumeric
- Floating point
- Integer
- Decimal
- Packed
- Date (opens
additional date related fields in the dialog box)
- Date-Time (opens
additional date related fields in the dialog box)
-
Length
- Choose an available number based on the format type you chose.
-
Select options
- Choose options based on the format type you chose.
-
Tree or List mode buttons
- Opens the field list in either tree or list mode.
-
Expression box
- To create an expression, double-click fields or functions,
select items (operators, numbers, characters) from the Field Creator
keypad, or type directly in the expression box.
-
Functions icon
- Displays a list of predefined functions grouped into categories
that include Character, Data Source and Decoding, Date and Time,
Format Conversion, Numeric, and System. If you hover your cursor
over a function, a brief description appears. The following image
shows the list of predefined functions that populate the Field Creator dialog
box when you select the Functions icon.
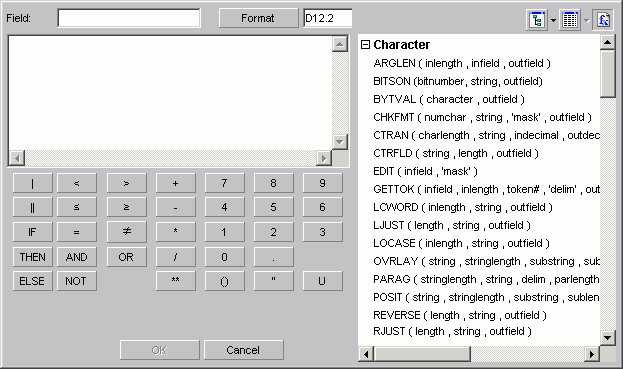
Double-click
the desired function to add it to the expression box in the Field
Creator dialog box. In the expression box, replace each of the function’s
arguments with the desired value or field name. Note that each of
the available functions is a program that returns a value.
For more information about functions,
see the Using Functions manual.
-
Concatenation operators
- Concatenates two or more alphanumeric constants and/or fields
into a single character string. The concatenation operator has two
forms: | (weak concatenation, which preserves trailing blanks) and
|| (strong concatenation, which moves trailing blanks to the end
of a concatenated string).
-
IF... THEN... ELSE... operators
- Creates a conditional expression. A conditional expression
assigns a value based on the result of a logical expression. The
assigned value can be numeric or alphanumeric. IF, THEN, ELSE logic
expressions take this form:
IF expression1 THEN expression2 ELSE expression3
ELSE
is an optional operator. All alphanumeric values in conditional
expressions must be enclosed in single quotation marks. For example,
IF REGION EQ 'West'.
-
Logical operators
- Used to create relational and Boolean expressions. A relational
expression returns a value based on a comparison of two individual
values (either field values or constants) and a Boolean expression
returns a value based on the outcome of two or more relational expressions.
The following
logical operators are available:
-
 adds
the less than (LT) operator to the expression. This operator returns
a value if the value on the left is less than the value on the right.
adds
the less than (LT) operator to the expression. This operator returns
a value if the value on the left is less than the value on the right.
-
 adds
the greater than (GT) operator to the expression. This operator
returns a value if the value on the left is greater than the value
on the right.
adds
the greater than (GT) operator to the expression. This operator
returns a value if the value on the left is greater than the value
on the right.
-
 adds
the less than or equal to (LE) operator to the expression. This
operator returns a value if the value on the left is less than or
equal to the value on the right.
adds
the less than or equal to (LE) operator to the expression. This
operator returns a value if the value on the left is less than or
equal to the value on the right.
-
 adds
the greater than or equal to (GE) operator to the expression. This
operator returns a value if the value on the left is greater than
or equal to the value on the right.
adds
the greater than or equal to (GE) operator to the expression. This
operator returns a value if the value on the left is greater than
or equal to the value on the right.
-
 adds
the equal (EQ) operator to the expression. This operator returns
a value if the value on the left is equal to the value on the right.
adds
the equal (EQ) operator to the expression. This operator returns
a value if the value on the left is equal to the value on the right.
-
 adds
the not equal to (NE) operator to the expression. This operator
returns a value if the value on the left is not equal to the value
on the right.
adds
the not equal to (NE) operator to the expression. This operator
returns a value if the value on the left is not equal to the value
on the right.
- AND returns
a value if both operands are true.
- OR returns
a value if either operand is true.
- NOT returns
a value if the operand is false.
-
Arithmetic operators
- Click any of the arithmetic operators to use them in your
expression: + (addition), - (subtraction), * (multiplication), /
(division), ** (exponentiation). Note that two operators cannot
appear consecutively.
-
Parentheses
- Adds parentheses to the expression box. Parentheses affect
the order in which the specified operations are performed. Note
that WebFOCUS performs numeric operations in the order of parentheses,
exponentiation, division and multiplication, and addition and subtraction.
-
Quotation marks
- Adds quotation marks to the expression box. Use single quotation
marks to enclose alphanumeric and date literals.
-
Uppercase (U key)
- Converts entries in the expression box to uppercase. Note
that field names are case-sensitive.