An active report provides customizable options for creating an
HTML-formatted report that enables users to experience features
similar to those found in Excel workbooks. An active report is designed
for distribution to users to perform offline analysis and interactive functions
without any connection to a server. All of the data and JavaScript
code are stored within the HTML file, which also makes the output
highly compressible for e-mail and transparent to security systems.
x
Syntax: How to Create an Active Technologies Report
To create an HTML active report, use
ON TABLE {PCHOLD|HOLD|SAVE} FORMAT {AHTML|FLEX|APDF}
where:
- PCHOLD
-
Displays the report output in a Web browser
in the format specified. PCHOLD is the default value.
- HOLD
-
Saves the report output to a temporary file
for later use.
- SAVE
-
Saves the report output to a file for later
use.
- AHTML
-
Creates an HTML version of the report.
- FLEX
-
Creates an Adobe Flash Player version of
the report (Adobe Flash file).
- APDF
-
Creates an Adobe Flash Player version of
the report (Adobe Flash file), embedded in a PDF file.
Example: Creating an Active Technologies Report
The following code generates an
HTML active report.
All customized (non-default)
values and corresponding keywords, used to specifically format an
HTML active report, are shown in bold.
TABLE FILE CENTURYSALES
SUM
     ORDERNUMBER
     ORDERDATE
     QUANTITY
     LINEPRICE
     BY PLANTCODE AS 'Plant'
ON TABLE SET PAGE-NUM OFF
ON TABLE SET BYDISPLAY ON
ON TABLE NOTOTAL
ON TABLE PCHOLD FORMAT AHTML
ON TABLE SET STYLE *
     UNITS=IN,
     SQUEEZE=ON,
     ORIENTATION=PORTRAIT, $
TYPE=REPORT,
GRAPHCOLOR='GREEN',
GRAPHCOLORNEG='RED', $ TYPE=REPORT,
FONT='ARIAL',
SIZE=9,
COLOR='BLACK',
BACKCOLOR='NONE',
STYLE=NORMAL,
FREEZE-WIDTH=AUTO,
LINES-PER-PAGE=30,
CALC-LOCATION=BOTTOM,$ TYPE=TITLE, STYLE=BOLD, $
TYPE=REPORT,
OBJECT=MENU,
COLOR=RGB(0 51 102),
HOVER-COLOR='WHITE',
BACKCOLOR=RGB(51 204 204),
HOVER-BACKCOLOR='PURPLE',
BORDER-COLOR='FUCHSIA', $ TYPE=REPORT,
OBJECT=STATUS-AREA,
COLOR=RGB(153 51 0),
BACKCOLOR='AQUA', $ TYPE=REPORT,
OBJECT=CURRENT-ROW,
HOVER-BACKCOLOR=RGB(255 255 153),
BACKCOLOR=RGB(255 153 0), $ TYPE=REPORT,
OBJECT=CALC-AREA,
COLOR=RGB(153 51 0),
BACKCOLOR=RGB(255 204 153), $ TYPE=REPORT, COLUMN=N2, CALCULATION=CNT, $
TYPE=REPORT, COLUMN=N4, CALCULATION=SUM, $
ENDSTYLE
END
The output is:
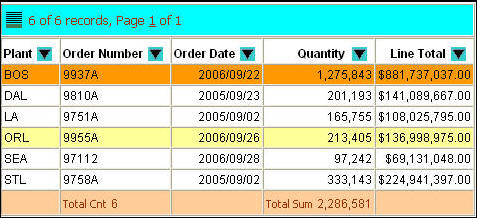
Starting at the top of the report, notice
the customized background colors, the record status and page navigation
bar, the first data row (which is selected), the fourth data row (which
is hovered), and the calculation row at the bottom.
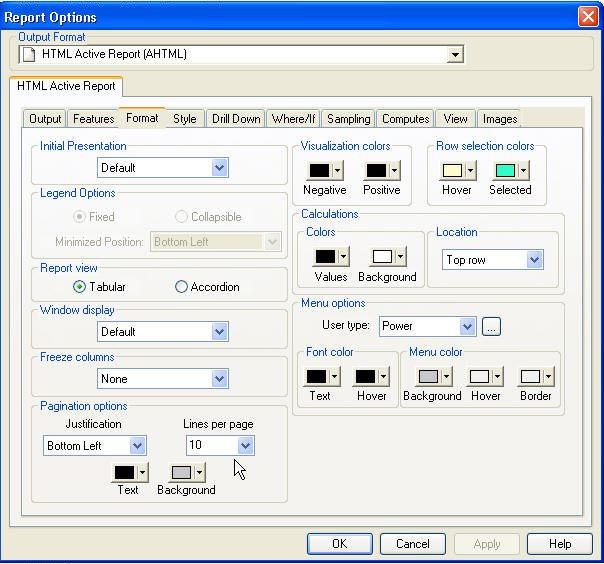
xControlling Formatting Options for Active Technologies Reports
Some of the formatting options can only be controlled
or implemented from the user menus in the output of an active report.
For more information about these options, see User-Controlled Options in an Active Technologies Report.
You can set the initial state of an active report by customizing
many report options with WebFOCUS
StyleSheet syntax. You can enable or disable some options prior
to distribution to users. The following syntax sections describe
the options you can control.
x
Syntax: How to Control the Report View Options
To control the report view options, which determine whether
a tabular or expandable report is created, use
ON TABLE SET EXPANDABLE={ON|OFF}
where:
- ON
-
Creates an expandable report.
- OFF
-
Creates a tabular report. OFF is the default
value.
The pagination and freeze options are not available with
the expandable report view option.
Tip: When you use active reports, it is recommended that
you set the system font display to normal to
ensure that the menu icons display correctly.
To
set the system font display, right-click anywhere on the desktop,
select Properties from the pop-up menu, select
the Settings tab in the Display Properties
dialog box, click the Advanced button, set
the Font Size to Small Fonts, and click OK.
These steps are for Windows 2000. They may vary by operating system.
x
Syntax: How to Control the Window Display Option
To control how windows display in the report output when
multiple windows are open in the Web browser, use
TYPE=REPORT, WINDOW-DISPLAY=coldesc, $
where:
- coldesc
-
Enables the report to display multiple
open windows as tabs or cascaded windows in the Web browser. Multiple
windows are created in the browser when viewing data as a chart,
a roll-up table, and so on.
Valid values
are CASCADE or TAB.
x
Syntax: How to Control the Row Selection Colors
To control the colors of the
row being selected or hovered over, use
TYPE=REPORT, OBJECT=CURRENT-ROW, HOVER-BACKCOLOR=hovercolor,
BACKCOLOR=selectcolor, $
where:
- CURRENT-ROW
-
Specifies the object, which is the current
row where the mouse pointer is clicked, or is hovering.
- hovercolor
-
Specifies the background color of the row
where the mouse pointer is hovering. The default value is RGB(255
252 204), which is a shade of yellow. Valid values can be either
a preset color name in single quotes, for example, 'YELLOW', or
the RGB (red green blue) numeric values, for example, RGB(255 255
153).
- selectcolor
-
Specifies the background color of the row
selected (click anywhere within a row). The default is RGB(51 255
204), which is a mix of green and blue. Valid values can be either
a preset color name in single quotes, for example, 'BLUE', or the
RGB (red green blue) numeric values, for example, RGB(153 53 0).
x
Syntax: How to Control User Menu Options
To control the user menu options,
which determine the location and color characteristics of the user
menu in the report, use the appropriate syntax section that follows.
To control all of the colors of the user menu, use
TYPE=REPORT, OBJECT=MENU, COLOR=textcolor,
HOVER-COLOR=hovertextcolor,BACKCOLOR=backcolor,
HOVER-BACKCOLOR=hoverbackcolor,BORDER-COLOR=bordercolor, $
where:
- MENU
-
Specifies the object, which is the user
menu.
- textcolor
-
Specifies the color of the text (font)
in the user menu. BLACK is the default value. Valid values can be
either a preset color name in single quotes, for example, 'YELLOW', or
the RGB (red green blue) numeric values, for example, RGB(153 153
153).
- hovertextcolor
-
Specifies the color for the hover text
in the user menu. BLACK is the default value. Valid values can be
either a preset color name in single quotes, for example, 'RED',
or the RGB (red green blue) numeric values, for example, RGB(255
255 153).
- backcolor
-
Specifies the color for the background
(non-text) areas in the user menu. SILVER is the default value.
Valid values can be either a preset color name in single quotes,
for example, 'GOLD', or the RGB (red green blue) numeric values,
for example, RGB(153 51 0).
- hoverbackcolor
-
Specifies the color
for the background area of the user menu where your mouse pointer
is hovering. WHITE is the default value. Valid values can be either
a preset color name in single quotes, for example, 'ORANGE', or
the RGB (red green blue) numeric values, for example, RGB(51 204
204).
You can use this, along with the hover
text color, to visually contrast the menu option where the mouse
is currently hovering from the rest of the menu.
- bordercolor
-
Specifies the color for the borders of
the user menu. WHITE is the default value. Valid values can be either
a preset color name in single quotes, for example, 'BLUE', or the
RGB (red green blue) numeric values, for example, RGB(255 255 153).
x
Syntax: How to Control the Calculations Options
To control the calculations options,
which determine the column and the calculation you want to perform,
along with the styling characteristics of the calculation results
row, use the appropriate syntax section that follows.
- To perform column
calculations, use
TYPE=REPORT, COLUMN=coldesc, CALCULATION=calc, $
where:
- coldesc
-
Specifies the description (column name
or identifier) of the column where you want to perform a calculation.
- calc
-
Specifies the
calculation to be performed. The default is no calculation.
For columns containing
numeric data, select from: SUM, AVE, MIN, MAX, CNT, CNT.DST, PCT.TOT
PCT.TOT values appear in a separate
column adjacent to the column for which it is calculated, and styling
is inherited from the visualization column.
For columns containing text (alphanumeric) data, select
from: CNT, CNT.DST
- To control the location
of the calculation results row, use
TYPE=REPORT, CALC-LOCATION={TOP|BOTTOM}, $
where:
- TOP
-
Specifies the top row of the report
as the location of the calculation results. TOP is the default value.
- BOTTOM
-
Specifies the bottom row of the report
as the location of the calculation results.
- To control the colors
of the calculation results row, use
TYPE=REPORT, OBJECT=CALC-AREA, COLOR=color, BACKCOLOR=backcolor, $
where:
- CALC-AREA
-
Specifies the object, which is the
calculation results row.
- color
-
Specifies the color for the calculation
values in the calculation results row. The default value is BLACK
and is inherited from the column title font color. Valid values
can be either a preset color name in single quotes, for example,
'RED', or the RGB (red green blue) numeric values, for example,
RGB(255 255 153).
- backcolor
-
Specifies the color for the background
in the calculation results row. The default value is WHITE and is
inherited from the column title background color. Valid values can be
either a preset color name in single quotes, for example, 'GOLD',
or the RGB (red green blue) numeric values, for example, RGB(153
51 0).
x
Syntax: How to Control the Active Technologies Cache Option
Because all post-retrieval processing is performed in
the memory of the Web browser, an active report has a processing
limit of approximately 5,000 records or 100 pages of output. The
active cache option enables you to send only the first page of active
report output to the browser and retrieve subsequent pages from
a temporary cache on the WebFOCUS Reporting Server. The server also
becomes the resource for performing all calculations, sorting, and
filtering when active cache is enabled. Since active cache uses on-demand
paging functionality, WebFOCUS Viewer is not supported.
To enable active
cache for active reports, use:
ON TABLE SET WEBVIEWER {ON|OFF}
ON TABLE SET CACHELINES {n|100}
where:
- ON
-
Runs the active report with active cache
enabled.
- OFF
-
Will not enable active cache when the active
report is run. OFF is the default value.
- n|100
-
Specifies the number of rows from cache.
The default is 100.
Tip: It
is recommended that you set the number of rows retrieved five times
greater than the number of lines retrieved per page (as indicated
in SET LINES). The minimum number of rows retrieved is 100. Setting
LINES greater than 200 with the AHTML output format produces a report
with no output. If editing the SET LINES syntax for a procedure
with AHTML, it is recommended that you code SET LINES equal to or
less than 200 since the Internet Explorer JavaScript engine is slower
than any other browser (such as Firefox, Opera, Chrome™, and so
on).
x
Syntax: How to Control the Visualization Colors Options
To control the colors of the
graphic values used with the visualization option, use
TYPE=REPORT, GRAPHCOLOR=positivecolor, GRAPHCOLORNEG=negativecolor, $
where:
- positivecolor
-
Specifies the color for the positive values
displayed in the optional visualization column. BLACK is the default
value. Valid values can be either a preset color name in single
quotes, for example, 'BLUE', or the RGB (red green blue) numeric
values, for example, RGB(255 255 153).
- negativecolor
-
Specifies the color for the negative values
displayed in the optional visualization column. BLACK is the default
value. Valid values can be either a preset color name in single
quotes, for example, 'VIOLET', or the RGB (red green blue) numeric
values, for example, RGB(153 153 153).
x
Syntax: How to Control the Freeze Column Options
To
control the freeze column options, which determine the column (and
all columns to the left) that will freeze when scrolling to the
right to view other columns in the report output, use
TYPE=REPORT, FREEZE-COLUMN=coldesc, $
or
TYPE=REPORT, FREEZE-WIDTH=AUTO, $
where:
- coldesc
-
Specifies the description (column name
or identifier) of the column you want to freeze. You can only specify
one freeze column, which must be a BY sort field. The default value
is none (no freeze column).
- AUTO
-
Enables the report to freeze at a particular
column that will be automatically determined by WebFOCUS for optimal viewing.
If you can view the entire report output on the screen
without scrolling, the freeze will not be applied.
The freeze option is not available with
the expandable report view option.
x
Syntax: How to Control Hide Columns Options
To control the hide columns options, which determine
the columns that will be hidden from view in the report output,
repeat the following for each column you want to hide.
TYPE=REPORT, COLUMN=coldesc, HIDE={ON|OFF}, $
where:
- coldesc
-
Specifies the description (column name
or identifier) of the column you want to hide. You can hide multiple
columns, but you cannot hide all columns (at least one column must
always be visible).
- ON
-
Enables the option.
- OFF
-
Disables the option. OFF is the default
value.
x
Syntax: How to Display NOPRINT Fields in an Active Technologies Report Menu
To display NOPRINT fields in the active report drop-down
menu, use
TYPE=REPORT, ALLOW-NOPRINT={ON|OFF}, $
where:
- ON
-
Displays all NOPRINT fields in the active
report menu.
- OFF
-
Does not display NOPRINT fields in the
active report menu.
Note: This
setting does not affect fields hidden using HIDE=ON syntax. In order
to simply hide the field, but make it available for later use in
an active report drop-down menu, use HIDE=ON syntax instead.
x
Syntax: How to Show or Hide Active Technologies Report Menu Options
To control active report menu options available to the
users, use
TYPE=REPORT, ALLOW-feature={ON|OFF}, $
where:
- feature
-
Specifies the feature. Select from:
PAGINATION to
enable the use of show records options.
FILTER to enable the use of filtering
or highlighting options.
FREEZE to enable the use of freeze column options.
CALC to
enable the use of calculation options.
HIDE to enable the use of hide
columns options.
CHART to
enable the use of chart creating options.
EXPORT to enable the use of exporting options.
VISUALIZE to
enable the use of graphical visualization options.
SORT to enable the
use of sorting options.
ROLLUP to enable the use of roll-up table options.
PIVOT to
enable the use of pivot table options.
COMMENTS to enable the use of
comment options.
WINDOW to
enable the use of window type options.
RESTORE to enable the use of
restore options.
SENDEMAIL to
enable the use of send as e-mail options.
SAVECHANGE to enable the use
of save changes options.
PRINT to enable the use of print options.
ACCORDION to
enable the use of accordion options.
TOOLS to enable the use Chart/Rollup
Tool, Pivot Tool, and Grid Tool options.
- ON
-
Enables the option. ON is the default value
for all user-controlled options.
- OFF
-
Disables the option.
xControlling the Pagination Options
For active reports, you can:
- Determine the number
of rows displayed per page and the styling characteristics of the
record status and page navigation bar. For details, see Determining the Number of Rows Per Page and Styling Characteristics.
- Customize the pagination
bar to display the range of records that appear on the current page
of the report, instead of displaying the default filtered number
of records and total number of records. For example, the pagination
bar on the first page of an active report might display the following
sample values:
1-25 records, Page 1 of 4
You can display the range of records that appear on
a page by creating a JavaScript file that overwrites the default
display. For details, see Displaying the Range of Records on a Page.
- Suppress the display
of the pagination bar. For details, see Suppressing the Display of the Pagination Bar.
x
Determining the Number of Rows Per Page and Styling Characteristics
This topic describes the syntax for determining the
number of rows displayed per page and the styling characteristics
of the record status and page navigation bar.
x
Syntax: How to Determine the Number of Rows Per Page and Styling Characteristics
Use the appropriate syntax
section that follows.
- To control the number
of rows displayed per page in the output, use
TYPE=REPORT, LINES-PER-PAGE={n|UNLIMITED},$
where:
- n
-
Specifies the number of rows displayed
on each HTML page. The default value is 20 rows when the LINES-PER-PAGE
option is used. Otherwise, the server default value is 57 rows.
- UNLIMITED
-
Specifies that you want to show all
the results on one HTML page.
- To control the position,
justification, and colors of the record status and page navigation
bar, use
TYPE=REPORT, OBJECT=STATUS-AREA,PAGE-LOCATION={TOP|BOTTOM},JUSTIFY={LEFT|CENTER|RIGHT},
COLOR=textcolor, BACKCOLOR=backcolor,$
where:
- STATUS-AREA
-
Specifies the object, which is the
record status and page navigation bar.
The record status and page navigation bar show row and page
information, where your cursor is positioned, relative to the total
number of rows and pages in the report (for example, 10 of 100 records
(10.00%), Page 1 of 3).
- PAGE-LOCATION
-
Specifies the location of the record
status and page navigation bar, which is either at the top of the
report above the report header, or at the bottom of the report below the
report footer. TOP is the default value.
- JUSTIFY
-
Specifies whether you want the information
in the record status and page navigation bar to be centered, left-justified,
or right-justified. CENTER is the default value.
- textcolor
-
Specifies the text color for the
record status and page navigation bar. BLACK is the default value.
Valid values can be either a preset color name in single quotes,
for example, 'GREEN', or the RGB (red green blue) numeric values,
for example, RGB(153 153 153).
- backcolor
-
Specifies the background color for
the record status and page navigation bar. SILVER is the default
value. Valid values can be either a preset color name in single quotes,
for example, 'WHITE', or the RGB (red green blue) numeric values,
for example, RGB(51 153 102).
The
pagination options are not available with the expandable report
view option.
x
Displaying the Range of Records on a Page
By default, the strings and parameters
used to display the pagination bar are stored in the irpstr.js file.
The irpstr.js file is located in the \home\etc directory
on the WebFOCUS Reporting Server.
Optionally, you can copy this file to your
application folder and edit the pagination bar string 'paglinetext'.
When a customized JavaScript file exists in an application folder,
the default pagination bar strings and parameters are overwritten
by the strings and parameters specified in the customized file.
You can have different customized irpstr.js
files in your application folders. This feature enables you to update
the active reports and active dashboards in your existing applications with
different pagination bars that meet your specific application needs.
x
Procedure: How to Display the Range of Records on a Page
-
Copy the file irpstr.js from
its location on the WebFOCUS Reporting Server (\home\etc directory)
and paste it into your application folder.
Important: The application folder must be the same one that
contains the active report or active dashboard. For example, from
the Projects on localhost area in Developer Studio, paste irpstr.js into
the Other subfolder of the project folder.
-
In the Developer Studio text editor, open
the irpstr.js file and locate the following
code:
'paglinetext':"<%^%rcs of %trcs records, Page %inds of %pgs%>
<span id='smsg%tn'><\/span>"
-
Replace
the preceding code with this code:
'paglinetext':"<%^%frcs-%lrcs records, Page %inds of %pgs%>
<span id='smsg%tn'><\/span>"
-
Save theirpstr.js file
and close the text editor.
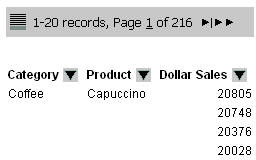
-
Run an active
report with format AHTML.
The pagination bar is displayed as follows. By default, 20
records are displayed on each page. As a result, the customized
pagination bar displays a range of 1-20 records on the first page.
-
To change
the default number of records displayed on each page, open the active report in Report Painter
or Report Assistant.
-
Follow the steps for the tool that you are using.
-
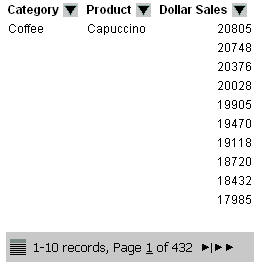
Run the
active report.
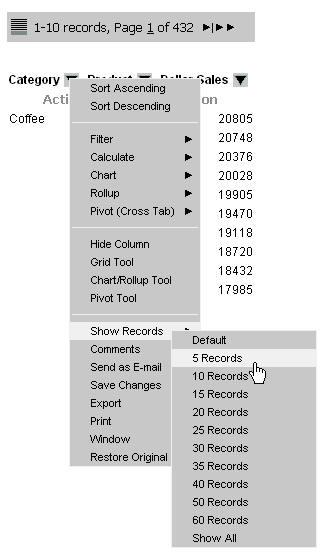
The pagination bar now
displays 10 records per page, as shown in the following image. Based
on the styling characteristics supplied in Report Painter, the pagination bar appears
at the bottom of the page, and the text inside the pagination bar
is left-justified.
Tip: You
can also specify the number of records to display per page when
a report is run. Click Show Records from
a drop-down menu on the report. In the following image, 5 Records
per page is selected.
x
Suppressing the Display of the Pagination Bar
You can suppress the display of the pagination bar using WebFOCUS StyleSheet code. This feature is available for active reports with
format AHTML, FLEX, or APDF.
ON TABLE SET STYLE *
TYPE=REPORT,
   OBJECT=STATUS-AREA,
   PAGE-LOCATION=OFF,
$
ENDSTYLE
Once you suppress the display of the pagination bar, you can
no longer navigate to a page after the first page if the number
of records in the report exceeds the records (lines) per page that
you set.