How to: |
To change the color of the border of the charts that are displayed on an active dashboard, you must change a value in a server-side JavaScript file. The change is applied to all active dashboards when they are run.
The default color of the border of charts is black.
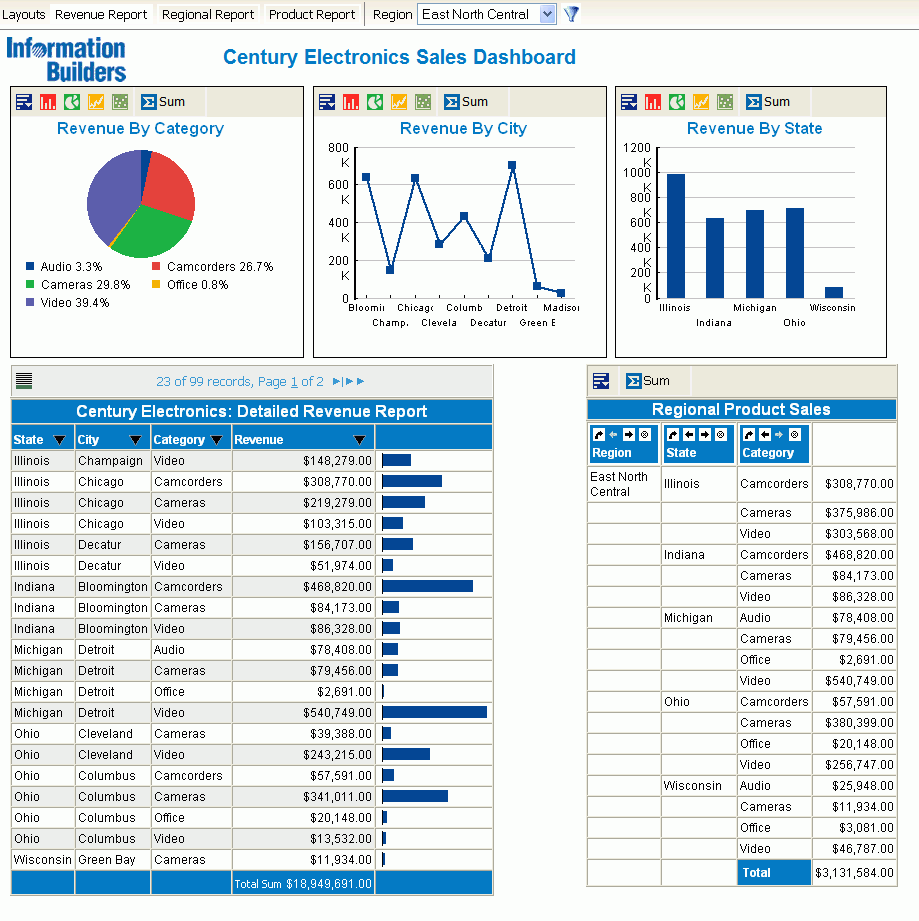
The following image shows a sample dashboard that is titled Century Electronics Sales Dashboard. The border of the pie, line, and bar charts is black.

This procedure describes how to change the color of the border of three charts on a sample active dashboard, from black (the default) to crimson.
if(mytable.a_cntl.reportView!=REPORTPIVOT)
     dobj.style.border=mytable.n_border+'px solid #000000';
There are many Web sites that give the hexadecimal values of colors. Search for the string hexadecimal color using your preferred search engine.
For example, the following link displays a sample Web page with colors and their hexadecimal values.
http://www.pagetutor.com/common/bgcolors1536.png
The following sample code shows a new value of #990022, which represents the color crimson.
if(mytable.a_cntl.reportView!=REPORTPIVOT)
     dobj.style.border=mytable.n_border+'px solid #990022';
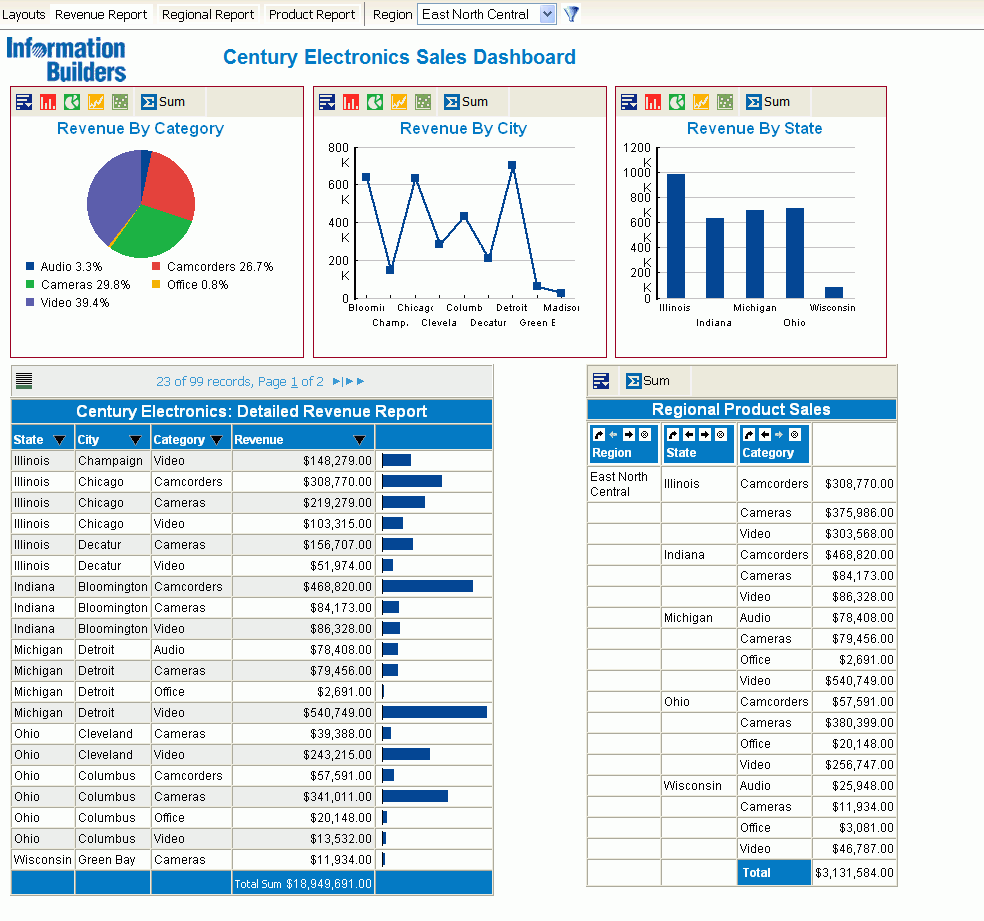
The sample Century Electronics Sales Dashboard displays the new color for the border of the pie, line, and bar charts, as shown in the following image.

| WebFOCUS |