- Create a report in the Report Painter.
-
From the
Report menu, click Output.
The Report Options dialog box opens.
-
From the
Output Format drop-down list, click active report for Adobe Flash
Player (FLEX) or active report for PDF (APDF).
Tip: You can also select these output formats from the output format drop-down list on the Report Painter toolbar.
-
On the Report
Options dialog box, click the Format tab.
The Format tab provides options for formatting an active report.
-
To enable
the Legend Options on the Format tab, use the Initial Presentation
drop-down list to select Bar Chart, Line
Chart, Pie Chart, or Scatter
Chart.
The Legend Options are enabled. The Legend Options are not available for the Default, Grid, Pivot, or Other Chart initial presentations.
-
Select the
Legend Options.
The chart legend can be fixed or collapsible in the output.
- Fixed. When the chart legend is fixed, the legend appears underneath the chart, and you cannot hide the legend or position a Legend icon. This is the default selection when the legend options are enabled.
-
Collapsible. When the chart legend is collapsible, you can
show or hide the chart legend in the output. You can also choose
where the Legend icon appears on the chart.
From the Minimized Position drop-down list, click Bottom Left, Bottom Center, or Bottom Right. Bottom Left is the default minimized position when you select Collapsible as the legend option.
- Click OK to close the Report Options dialog box.
-
Click Run to
view the output.
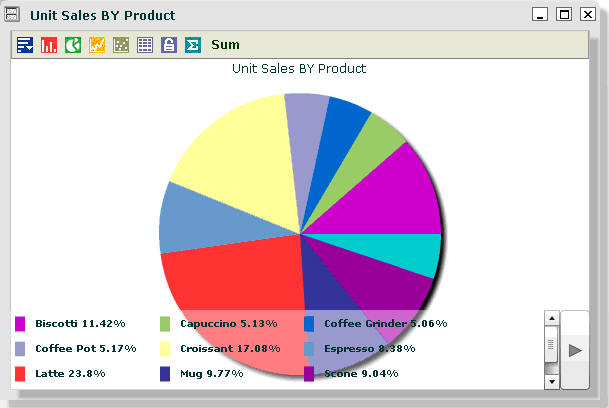
The following image shows a pie chart with a fixed legend. The format of the chart is FLEX.
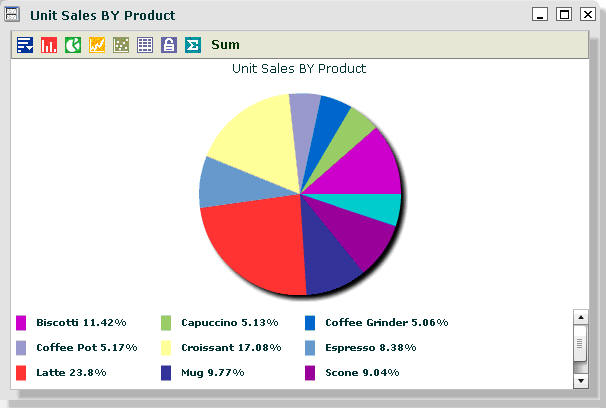
The following image shows a pie chart with a collapsible legend. The format of the chart is FLEX. The Legend icon is positioned at the bottom left by default. Click the arrow to show or hide the chart legend.
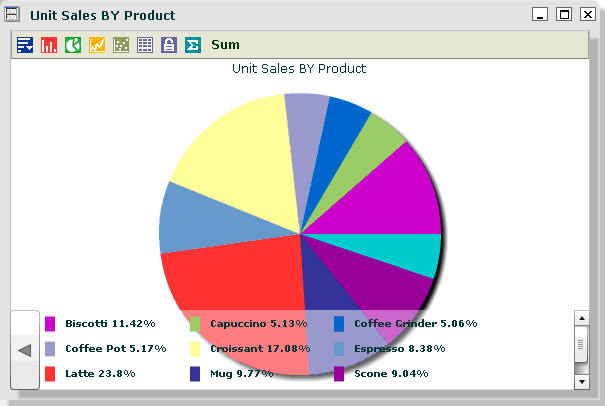
The following image shows a pie chart with a collapsible legend. The format of the chart is FLEX. The Legend icon is positioned at the bottom center. Click the arrow to show or hide the chart legend.
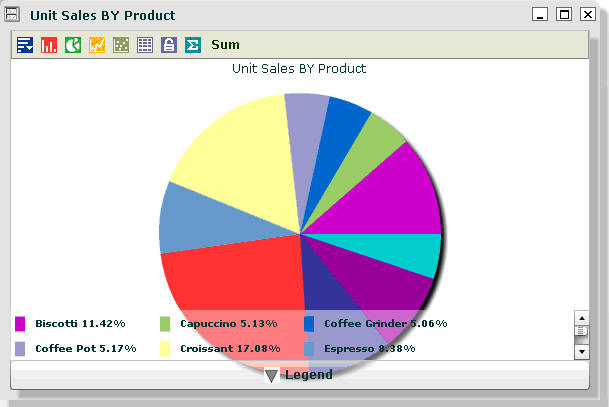
The following image shows a pie chart with a collapsible legend. The format of the chart is FLEX. The Legend icon is positioned at the bottom right. Click the arrow to show or hide the chart legend.