Reference: |
You can apply the following custom formatting to an active report.
- Report view. You can set the report view as a standard table or as an expandable report. An expandable report is a collapsed report that can be fully expanded for sorting and other purposes.
- Pagination options. You can set the justification for the information that appears in the record status and page navigation bar and set the number of records that appear per page. Pagination options are not available for expandable report views.
- Calculations. You can set certain calculations for fields in the report. You set calculation results to show in a row that appears either above or below the report.
- Color. You can set the color for data visualization graphs, the text and background for the record status and page navigation bar, selected rows, the value and background for calculations, and the text, background, and border for the menu.
- Freeze columns. You can freeze the report at a particular point so that columns to the left of the freeze point remain in view while the user scrolls through the other report columns.
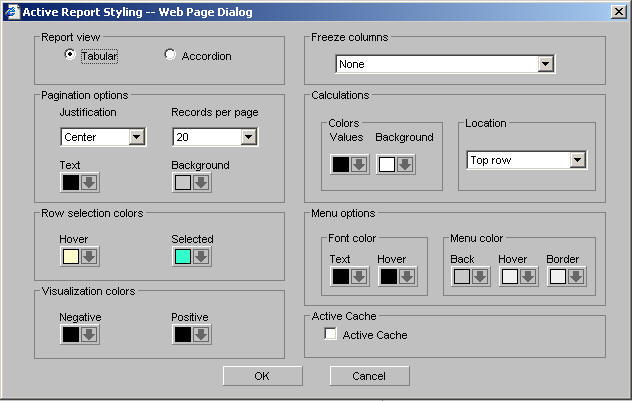
The following are active report styling options.
- Report view
-
You can set the report view as a standard table (Tabular) or as an expandable report (Accordion). An expandable report is a collapsed report that can be fully expanded for sorting and other purposes.
If you are working with an Accordion active report, the Freeze columns option and Pagination options are not available.
Accordion Reports are not supported when creating HTML active reports using active cache and active reports for Adobe Flash Player.
Accordion Reports do not work when using By Hierarchy data.
- Pagination options
-
You can set the justification for the information that appears in the record status and page navigation bar. You can also set the number of records that appear per page.
The following are the pagination options for active reports.
- Justification
-
Justifies the text that appears in the record status and page navigation bar. Options are Left, Center, and Right. Left is the default.
- Records per page
-
Sets the number of records that appear per page. Options are Default, 10, 20, 30, 40, 50, Show All. The default is 57 lines per page.
- Text
-
Sets the color for the text in the record status and page navigation bar. The default is black.
- Background
-
Sets the background color for the record status and page navigation bar. The default color is silver.
Pagination options are not available for expandable report (Accordion) views.
- Row selection colors
-
An active report offers visual assistance for viewing data in the report. For example, when a user hovers over a row of data, the row is highlighted with a background color, and when they click a row of data, it is also highlighted with a background color. You can set the colors for these options, Hover and Selected. The default color for Hover is RGB(255 252 204), which is a pale yellow, and the default color for Selected is RGB(51 255 204), which is blue-green.
- Visualization colors
-
Users can apply data visualization to numeric fields in an active report. You can designate the colors of the bars. You can set different colors for positive and negative values. The default color for positive and negative values is black.
- Freeze columns
-
You can freeze the report at a particular point so that columns to the left of the freeze point remain in view while the user scrolls through the other report columns. Options include:
- None, which turns off the freeze option. This is the default value.
- The fields in the request. If the report can be fully viewed in the browser window, freeze is not applied.
The Freeze columns option is not available for expandable report (Accordion) views.
- Calculations
-
Sets options for calculations.
- Colors
-
Specifies the colors for the values in a calculation.
- Values sets the font color of the calculation results. The default color is black.
- Background sets the background color of the calculation results. The default color is white.
- Location
-
Sets the location of the calculations. Options are Top row or Bottom row. Top row is the default.
- Menu options
-
Set options for the menu.
- Font color
-
Enables you to set the colors for the menu text.
- Text sets the color of the text. The default color is black.
- Hover sets the color of the text when the mouse hovers over it. The default color is black (text hover does not show).
- Menu color
-
Set the colors for the menu.
- Background sets the background color of the menu. The default color is silver.
- Hover sets the background hover color of an individual item on the menu. For example, if the background color of the menu is black, the hover color can be set to white to visually show which option on the menu the mouse is currently hovering over. The default color is white.
- Border sets the color of the menu border. The default color is white.
- Active Cache
-
Select this option to enable active cache.
Because all post-retrieval processing is performed in the memory of the Web browser, an active report has a processing limit of approximately 5,000 records or 100 pages of output. The active cache option enables you to send only the first page of active report output to the browser and retrieve subsequent pages from a temporary cache on the WebFOCUS Reporting Server. The server also becomes the resource for performing all calculations, sorting, and filtering when active cache is enabled. Since active cache uses on-demand paging functionality, WebFOCUS Viewer is not supported.
In Report Assistant, the active cache option is not applicable to active reports for Adobe Flash Player.