How to: |
The server recording feature can record the exact sequence of user actions applied through a browser into a script. The script can then reproduce that sequence ("play it back"), simulating single or multiple users under varying conditions to produce execution statistics.
The Run Stress feature uses an existing procedure to produce the script. It also and changes the browser session to the Diagnostics Scalability Playback Start/Stop page for the script.
The files used by playback and the recorded sequences are known as HTI scripts and are saved in the scalability directory. The scripts can be used along with server traces for problem diagnostics, analysis and testing.
One may go back to the Diagnostics Scalability Playback page at any time off the main menu and create a new script by recording a session activity (top menu bar) or an edit session (top menu bar) plus edit or re-run an existing script.
You can run a stress test on a procedure from the Web Console.
- From the Web Console menu bar, click Applications
or
from the Data Management Console, expand the Server node folder.
On the Web Console, the Applications page opens.
- Expand an application folder.
- Right-click a procedure, select Run Advanced,
and then Run Stress.
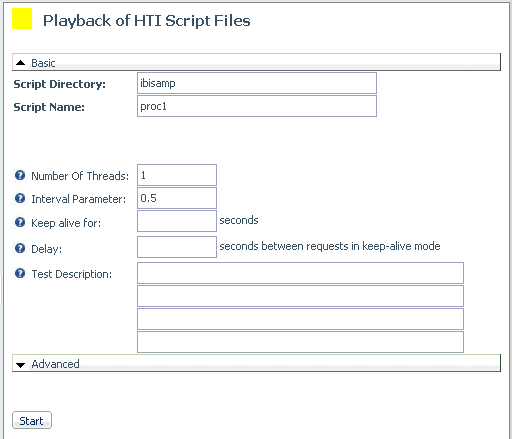
The Playback of HTI Script Files page opens.

- Enter basic test conditions: Number of Threads, Interval Parameter, and a Test Description. Click Advanced if you wish to specify additional conditions.
- Click Start. Results are displayed in
a separate window. For an illustration, see Sample Stress Test Log.
The script is listed under the tested procedure in the directory C:\ibi\scale.
- Open the Performance Reports folder on the Playback navigation
pane and choose:
- Basic Report
- Extended Report
-
Custom Report
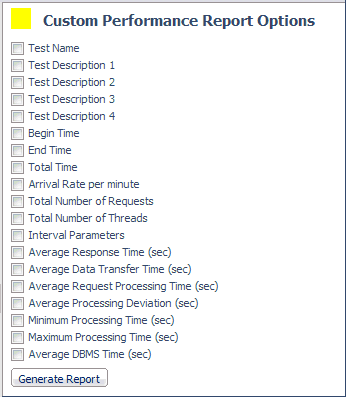
If you choose Custom Report, the Custom Performance Report Options page opens.

Select the options you want to see and click Generate Report.
---- Started at 12:57:32 ----
Received: thread=01 request=0001; timing: resp=0.062 sec, transf=0.000
sec, start=06/29/2005 12:57:32
---- Finished at 12:57:32 ----

Total Execution Time:               0.094 sec
Total Number of Requests:           1
Total Number of Threads:            1
Interval Parameters:                500,-1,-1
Average Server Response:            0.062 sec
Average Data Transfer Time:         0.000 sec
Average Request Processing Time:    0.062 sec
Standard Processing Deviation:      0.000 sec
Minimum Processing Time:            0.062 sec
Maximum Processing Time:            0.062 sec
Average DBMS Time:                  3.559 sec
terminating main thread
Basic Report

Extended Report

Custom Report
