In this section: How to: Reference: |
The Trace Tool is an independent tracing tool that captures all traces for the client applications, which use the API. To capture traces, the Trace Tool must be started before the client application connects to a server. Once the Trace Tool is started, traces are turned on and all API traces are written to the trace window and optionally a trace file. Traces may also be filtered for specific message types if so desired.
Warning: Tracing adds significant overhead and should only be used for application debugging.
The Trace Tool menu bar options enable you to review, modify, and save tracing information about applications running on the client workstation. To activate tracing and the tracing tool select the "Client Tracing Tool" icon from the Diagnostic Functions folder under where the Client software was installed on the Windows Start Menu.
The tool will start with an empty window and menu pull downs for File, Edit, Options and Help as described below. Once the tool is active, then start the client application. Application than are already running will not be traced!
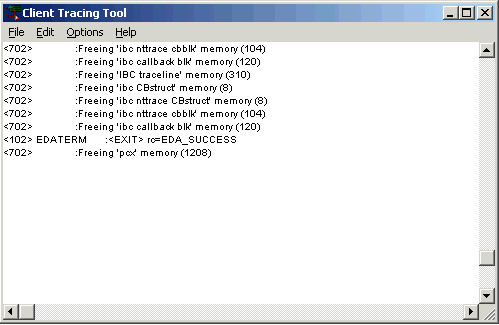
The trace tool should look like the following image after the start of the GUI iWay Test Tool.
Use the File drop-down menu to save tracing information, and save user-tracing profile. You can also use this menu to exit the Trace Tool. The following table describes the options and functions of the File drop-down menu:
Option |
Function |
Save |
Saves current window |
Save As... |
Saves current window to selected file. |
Set Trace Log File |
Selects log to trace to. |
Exit |
Closes the Trace Tool. |
Typical window edit functions for find, clear, select, delete, copy.
Use the Edit drop-down menu to clear, copy, select, or find text in the Trace Tool window. The following table describes the options and functions of the Edit drop-down menu:
Option |
Function |
Find |
Enables you to search for text within the trace. |
Clear |
Erases all information in the window. If you do not clear the window before you execute a new trace, any new messages are appended to the information that already exists in the window. |
Select All/None |
Selects all trace information in the window, which can then be deleted or copied. |
Copy |
Copies selected information in the window to the Clipboard, while leaving the original text on the screen. |
Delete |
Enables you to delete portions of text. |
Use the Tool drop-down menu to control the appearance of the tracing window and to select specific display format options. The following table describes the options and functions of the Tool drop-down menu:
Option |
Function |
Font... |
Opens a window that you use to control font size and color in the window. |
Background Color... |
Opens a window that you use to control background color in the window. |
Always on Top |
Ensures that the window always displays on the screen, and is not covered by other windows. Other windows requiring responses may appear behind the trace window, and consequently may not be visible. In such cases, moving the window will reveal the hidden windows. Note: Using Always on Top can, in some cases, conflict with third party screen saver programs. If conflicts do occur, set this option to OFF. |
Defer Traces |
Defers output of traces to the output window until the Defer Traces option is unchecked. |
Filter Traces |
Provides the ability to set tracing buffer size, trace-formatting options, and adds user-defined keywords to customize trace view. |
Log Traces |
Turn logging of traces to the traces file on (checked) or off (unchecked). Use the File menu/Set Trace Log File to name the file the tracing is going to. |
Autosave Setting |
Any settings changes are immediately save so they always maintained. |
Save Settings Now |
Save settings changes now. |
Typical windows help pull-down with help and about application information.
By default all tracing levels are active when the tool is started. Selecting the Options/Filter Traces option brings up the following image to turn off selected trace messages.
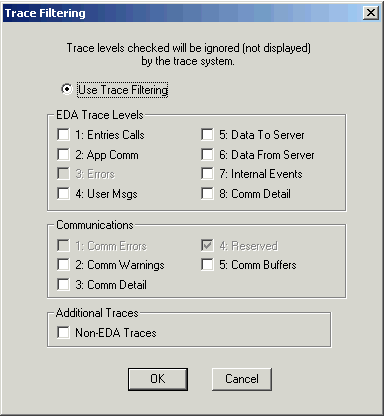
Note: That certain message cannot be turned off.
API Entry/Exit Traces. This trace level displays each entry to and exit from an API command and the parameter values processed. These calls are a result of the commands sent by the client application, as well as those called internally by the API:
101 |
Represents an entry point. |
102 |
Represents a normal exit. |
103 |
Represents an abnormal exit. |
API Resources. This trace level records communication calls made by an API client to the server, and the status of these communication events as recorded by the API:
201 |
Sending an SQL Request. |
202 |
SELECT * FROM CAR. |
203 |
Sent SQL Request/Receiving Data. |
204 |
Displays internal requests (for example, COMMIT WORK). |
205 |
Rcvd EOT. |
Errors. This trace level records API internal events:
325 |
Analyzing field description data. |
326 |
Encountering result rows. |
335 |
SCB3 created. |
336 |
SCB3 destroyed. |
347 |
Default call to EDAQUIT. |
API User Messages. Provides results from EDA SET commands:
401 |
Entry point. |
402 |
Normal exit. |
403 |
Abnormal exit (as per 1). |
API Output Buffers. This trace level displays the data sent to the server in addition to the SQL being passed from the client:
501 |
SQL |
501 |
END |
501 |
TABLE |
501 |
ON TABLE PCHOLD FORMAT ALPHA |
501 |
END |
502 |
Sending EOT |
API Input Buffers. This trace level displays data entries being received by the client. This can be useful in determining whether the client is receiving the correct data:
601 |
EDA-Task 175: Rcvd SYSPRINT |
601 |
EDA-Task 175: HOLD.MAS |
602 |
EDA-Task 175: HOLD.FTM |
602 |
EDA-Task 175: DATAVALUEFROMSERVER |
API Internal Events. This trace level displays internal event tracing. Events such as memory allocation, spooling, and the receipt of Info Blocks are displayed at this level:
716 |
EDA-Task 423: Allocating 224 bytes of memory. |
720 |
EDA-Task 305: INFO blocks -#cols:1,a_sz:1,b_sz:1,#rows:1. |
740 |
EDA-Task 807: Sending on 1, Spooling out 3. |
Communication Traces. This trace level displays the API communication.
851 |
Receive in next event. |
814 |
Receive for hses: 65536 |
API Internal Events. Server communications trace messages that are further defined in the ODIN Communication Trace Levels.
The ODIN Communication Trace Levels include:
1 - (901) Errors
2 - (902) Warnings
3 - (903) Detail
4 - (904) Reserved for future use
5 - (905) I/O Buffers
Applications. Displays third-party traces.
To activate tracing and the tracing tool select the Client Tracing Tool icon from the Diagnostic Functions folder under where the Client software was installed on the Windows Start Menu.
Note: The Trace Tool must be started before the application connects to the server.
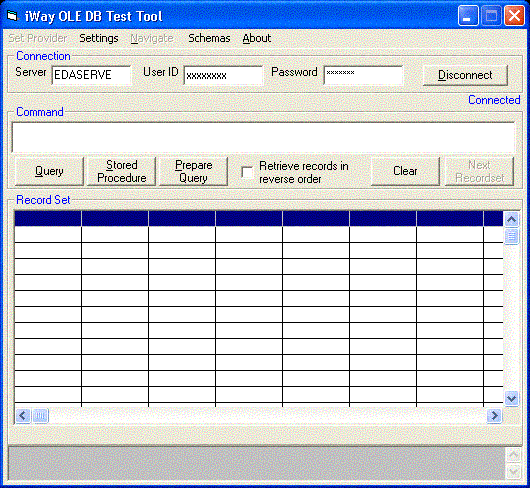
Two standard test tool applications are provided with the software and should be used to do initial testing to determine if a problem is customer application specific or generic. The test tools provide simple SQL input and output display. These are test tools and should not be used for production purposes. The tools can be found in the Diagnostics Functions folder in the software on the Windows menu. The names and purposes are:
Test Tool - ODBC | Uses ODBC connection. |
Test Tool - OLEDB | Uses OLE DB connection. |
The SQL result set displays in the Results window of the Test Tool.
For ODBC:

For OLE DB:
The trace information is now available for review in the trace tool window. Use the window scroll bar, or PageUp and PageDown keys.
| iWay Software |