How to: |
To make your HTML reports more powerful, you can insert visual representations of selected data directly into the report output. These visual representations are in the form of vertical or horizontal bar graphs that make relationships and trends among data more obvious. Data visualization graphs can be used with a Managed Reporting report or WF Server Procedure.
For example, the following code retrieves information from the CENTHR data source:
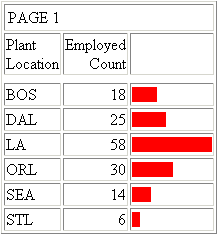
SET BASEURL=http://hostname[:port]/
TABLE FILE CENTHR
SUM EMP_COUNT
BY PLANT
ON TABLE SET STYLE *
GRAPHTYPE=DATA, FIELD=EMP_COUNT, GRAPHCOLOR=RED,$
END
where:
Is the host name (or IP address) and port number of the Web server on which the WebFOCUS Client is installed. If the port number is 80 (the default), you may omit the colon and port number. For example,
hostnameIf the port number is not 80, use a colon as a delimiter and then specify the port number. For example,
hostname:81The resulting output, which can be distributed by ReportCaster, appears in graph format, as shown in the following image.
To use data visualization files on a Web server without WebFOCUS installed on it, you must:
For more information about creating the WebFOCUS /ibi_html alias, see the WebFOCUS and ReportCaster Installation and Configuration manual for your platform.
| WebFOCUS |