Drilling Down On Dimensions and Measures
You can drill down on dimensions in OLAP reports and
graphs and, also, on measures in reports. The settings activate
the required hyperlinks:
-
Dimensions enables
automatic drill downs on dimensions in reports and graphs.
-
Dimensions and Measures enables
automatic drill downs on dimensions in both reports and graphs and
on measures in reports.
-
None disables
automatic drill downs. This is the default.
In Developer Studio, you can set drill-down options from the
Report Options Features tab. For details about this setting, see Setting OLAP Reporting Options.
Example: Drilling Down on Dimensions in a Report
This
report you are about to run uses data from a hierarchy that contains
three dimensions, each of which has three elements. The report is
sorted by the specified field from each dimension. The following
table outlines three dimensions, Time Period, Location, and Product
Dimension to which each contains three elements.
|
Time Period
|
Location
|
Product Dimension
|
|---|
|
Year
|
Manufacturing Plant
|
PRODTYPE
|
|
Quarter
|
State
|
PRODCAT
|
|
Month
|
Store Name
|
PRODNAME
|
The report will show data at different levels
in each dimension: Quarter is down one level in its dimension, Store
Name is at the lowest level in its dimension, PRODTYPE is the top
level in its dimension. This determines how much farther you can
drill down within each dimension. If you drill down on a value of
Quarter, the report shows information broken down by Month within
that Quarter. The Quarter column itself will no longer appear.
- Run the Standard
Report OLAPREP2.
In
this quarterly report, drill-down hyperlinks are active for both
dimensions and measures.
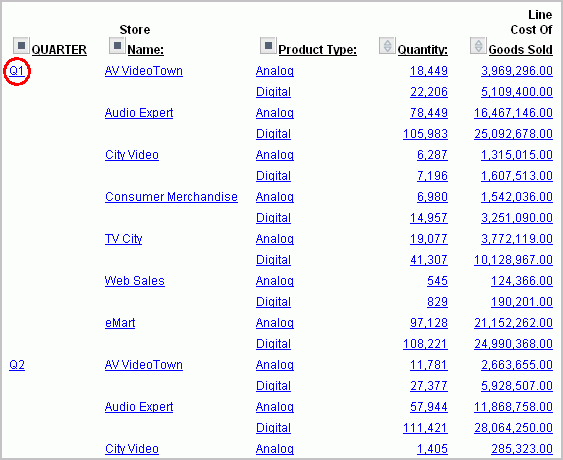
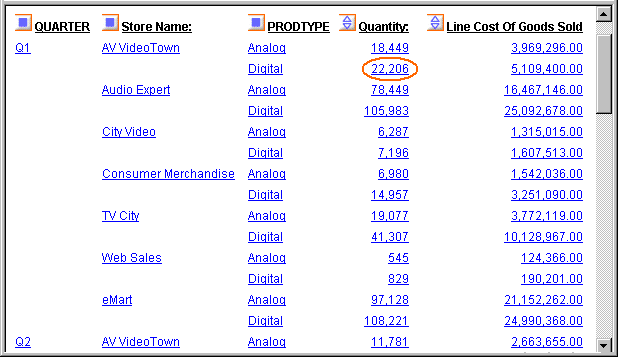
- Click Q1 in
the quarterly report, shown in the following image, to see a monthly
report.
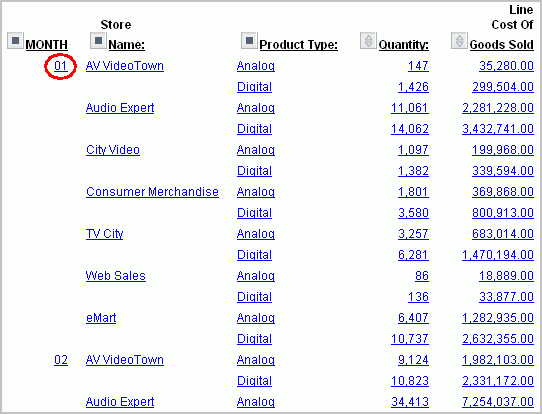
The
monthly report looks like this. Since Month is the bottom level
in its dimension, if you drill down on a month value, you will no
longer see the month column. However, you will see the data that
relates to the selected month in subsequent columns.
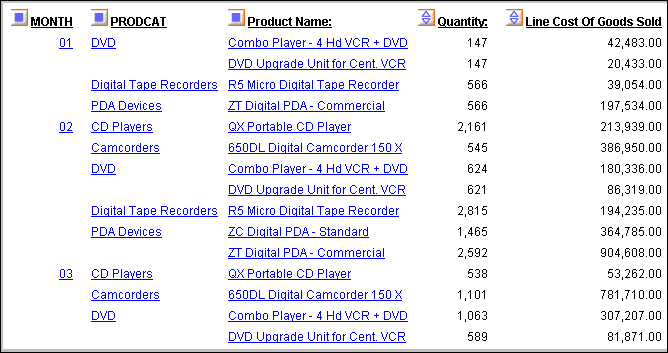
- Click the 01 in
the monthly report, shown in the following image, to see details
for January.
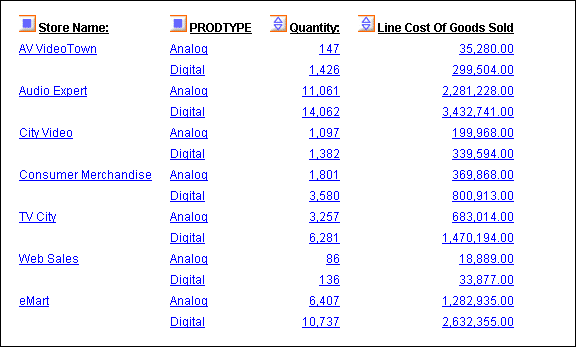
As
shown in the following image, the January report shows product type,
quantity, and line cost of good sold for each store.
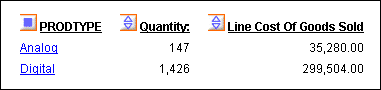
Next,
see what happens when you drill down in the Location dimension (in
this case, on a value of Store Name in the second column of the
report). When you drill down on a dimension column other than the
first, output is affected to the right and left of that column.
- Click the Back button,
in the browser, to return to the monthly report, then click AV
VideoTown in the second column.
Since Store Name
is the lowest level in its dimension, the Store Name column no longer
appears, nor does the Time Period column to its left. Nevertheless,
both the store name (AV VideoTown) and the current time period (January)
set the context for the information you see, which now consists
of types of products sold, quantity sold, and line cost of sold
goods for AV VideoTown in January, as shown in the following image.
Example: Drill Down on Measures in Reports
By
drilling down on a measure, you expose the next level of detailed
information associated with that measure for each displayed dimension
in the hierarchy. In other words, when you drill down on a measure,
the current dimension is used as a limiting criterion. The rest
of the hierarchy is then expanded based on that limitation.
Remember
that a measure contains quantitative information about fields in
each dimension.
In this example, Quantity and
Line of Sold Goods provide data about products at particular stores
during particular time periods.
- Run the Standard
Report OLAPREP2.
Notice
that quantity of sales for all digital products at AV VideoTown
in the first quarter of the year is 22,206. You want to find out
how much each digital product contributed to the total quantity.
- Click 22,206 under
Quantity, as shown in the following image.
As
shown in the following image, the report now shows total quantity
for digital products sold at AV VideoTown broken out by month, product
category, and product name. Notice that Store Name no longer appears.
Since it is the lowest level of the Location dimension, there is
no lower level of detail.
Since
all relevant information is now visible, no further drill downs
are possible and the measure is no longer represented as a hyperlink.
Next,
verify this behavior at another level in the hierarchy.
- Click the Back button
in your browser to return to the original report.
- Click Q1 to
see the monthly breakdown for that quarter.
- Click AV
VideoTown. You are now looking at types of products
sold, quantity sold, and line cost of goods sold at AV VideoTown.
- Drill down
on 1,426 under Quantity, as shown in the following
image.
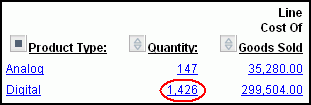
PRODTYPE Digital serves
as the limiting criterion. Therefore, the expanded hierarchy shows
the next level of detail for each digital product. This level is
comprised of digital product categories (PRODCAT) and the names
of the products in each category (Product Names).
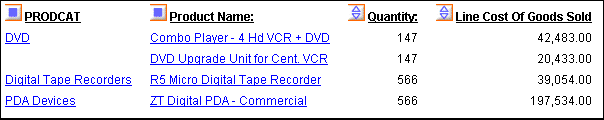
The report
displays, as shown in the following image, the detailed data for
each element in the PRODTYPE dimension (in this case, the product
categories and product names that comprise the quantity figure of
1,426). The total quantity and, correspondingly, the line cost of
goods data, is now broken down by product.
Note
that when you drill down on a measure value, results may differ
depending on the combination of sort fields in the report. The examples
that follow show several variations.
Example: Drilling Down on a Measure in a Report With ACROSS Fields
When
you drill down on a measure in a report with at least one dimension
Across field and no By fields, all Across fields are removed from
the report and all of the dimension elements under the removed Across
fields become By fields from left to right in the resulting report.
(This convention ensures that the maximum number of Across values
supported by WebFOCUS is not exceeded.)
The values that appear
for the new By fields are controlled by internally generated selection
criteria. The measure values in the resulting report depend on the
values of the new By fields.
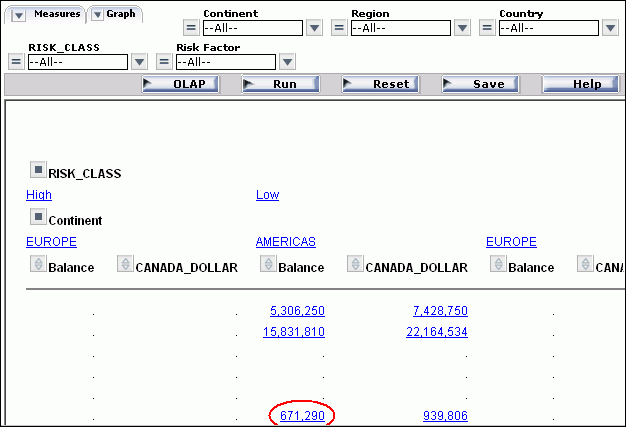
- Run the Standard
Report OLAPREP3.
In
the report, RISK_CLASS and Continent are dimension Across fields
on which you can drill down.
- Click the Balance
value 671,290 under RISK_CLASS Low and Continent
AMERICAS, as shown in the following image.
The
report now looks like the following image.
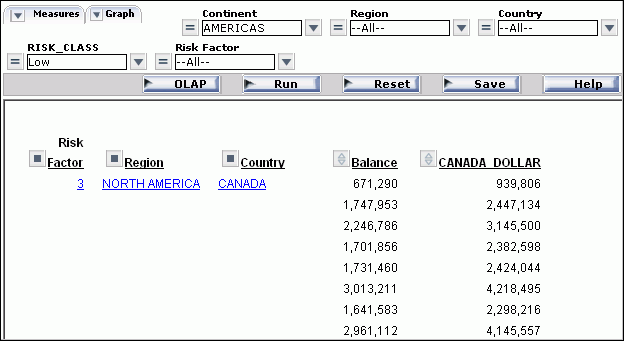
In
the new report, the RISK_CLASS and Continent fields are removed
based on two internally generated criteria: IF RISK_CLASS EQ 'Low'
and IF Continent EQ 'AMERICAS'.
The only dimension element
under RISK_CLASS is Risk_Factor. The dimension elements under Continent
are Region and Country. These become By fields in the new report,
from left to right. The data displayed for the measures in the resulting
report are those that satisfy the values in the current By fields.
Example: Drill Down on a Measure When BY/ACROSS Fields Are Under the Same Dimension
When
you drill down on a measure in a report with at least one By and
one Across dimension field under the same root dimension, both the
By and Across fields are hidden and the subordinate element(s) in
the same dimension becomes By fields in the new report. In effect,
the report is filtered based on the values of the dimensions. As
a result, the sorting controlled by both hidden and visible dimensions
remains in effect.
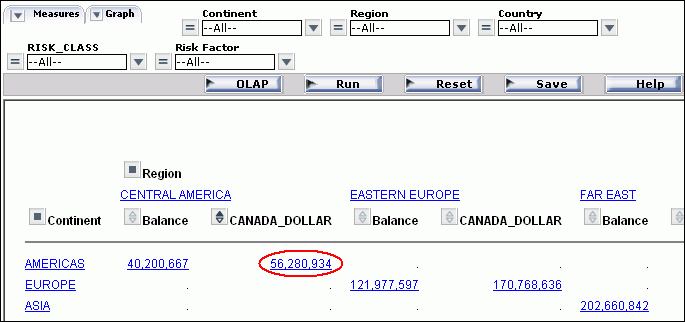
- Run the Standard
Report OLAPREP4.
In
the report, Continent is a By field and Region is an Across field.
Both are in the Geographic Area dimension.
- Click the CANADA_DOLLAR
value of 56,280,934 in the Continent row
for AMERICAS under the Region CENTRAL AMERICA, as shown in the following
image.
The
report now looks like the following image.
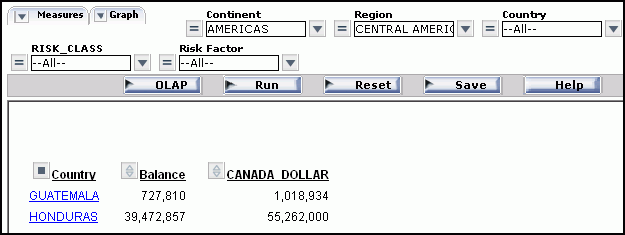
In
the new report, data is filtered based on the internally generated
criteria: IF Continent EQ 'AMERICAS' and IF REGION EQ 'CENTRAL AMERICA.'
(Continent and Region are no longer visible.)
REGION is replaced
by the last element in the Geographic Area dimension, Country, which
becomes the controlling By field in the report. The data displayed
for the measures are those that satisfy the values in the current
By field.
Example: Drill Down on a Measure When BY/ACROSS Fields Are Under Different Root Dimensions
When
you drill down on a measure in a report with at least one By and
one Across dimension field from different root dimensions, the By
fields are broken down to their last dimension level, then the Across
fields are broken down.
The original By and Across
fields are removed. The dimension elements under the removed By
fields become the first set of By fields from left to right. The
dimension elements under the removed Across fields follow the first
set of By fields from left to right.
- Run the Standard
Report OLAPREP5.
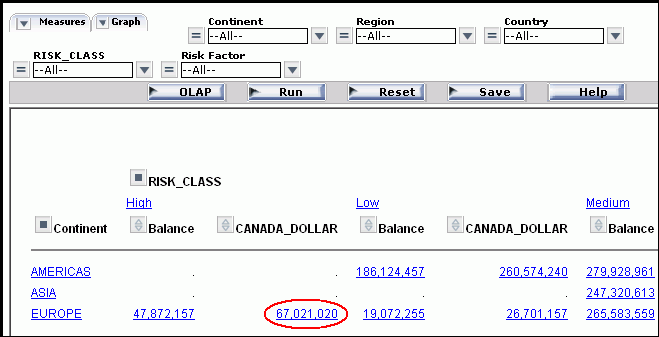
In
the report, Continent is a By field from the Geographic Area dimension
and Risk Class is an Across field from the Risk dimension.
- Click the CANADA_DOLLAR
value of 67,021,020 in the Continent row
for EUROPE under the RISK_CLASS High, as shown in the following image.
The
report looks like the following image.
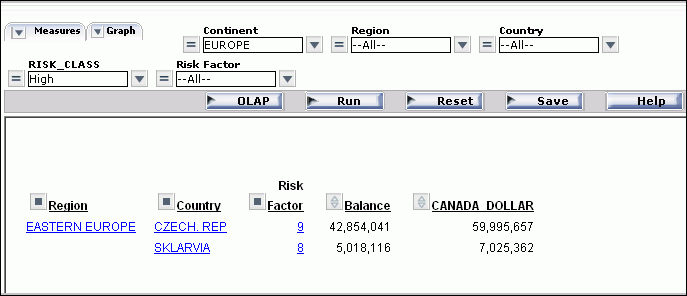
In
the new report, the Continent and RISK_CLASS fields are removed
based on the internally generated criteria: IF CONTINENT EQ 'EUROPE'
and IF RISK_CLASS EQ 'High'.
The By field (Continent) is broken
down to its last dimension element. Then, the Across field (RISK_CLASS)
is broken down to its last dimension level. The resulting By fields
in the report, from left to right, are Region, Country, and Risk
Factor. The data displayed for the measures satisfy the values in
the current By fields.