Reference: |
In addition to using OLAP-enabled data, a report must be enabled to support OLAP analysis. OLAP-enabling a report consists of specifying how a user will interact with and drill down on OLAP data.
The primary interactions occur in the report itself. In addition, you can choose to expose two supplementary tools, the OLAP Selections pane and the Control Panel.
Developer Studio
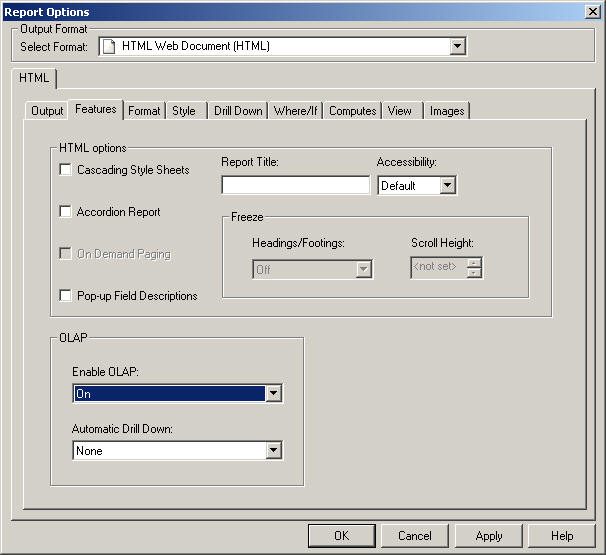
In Developer Studio, OLAP options are available on the Options Features tab in Report Painter. The relevant options (Enable OLAP and Automatic Drill Down) are located in the OLAP section of the tab, as shown in the following image.
Tip: In the Report Painter, you can also make OLAP selections from the OLAP option on the Report menu. For more information about using Report Painter, see the Creating Reports With Report Painter manual.
OLAP Interface Options
The Enable OLAP options in Developer Studio control how users can interact with an OLAP report and access OLAP tools.
For Standard Reports delivered to Managed Reporting users, these decisions are made by Managed Reporting content developers. However, users who are creating their own reports can OLAP enable them and control the OLAP interfaces and following drill-down options.
- Disabled. OLAP options are disabled and not shown in the OLAP report.
- Off. Turns off the OLAP Control Panel and the OLAP Selections pane, but allows OLAP functionality from the report itself. You can access options on right-click menus, drag and drop columns within the report, and use up and down arrows to sort columns from high to low or low to high.
- On. Provides access to the OLAP Selections pane from a square button to the left of the column titles. You can open the Control Panel by clicking the OLAP button in the OLAP report.
- Top Panel. Opens the OLAP Selections pane above the report. The Measures, Graph, and Dimension controls, as well as the band containing the OLAP, Run, and Reset buttons appear above the report output. You can open the Control Panel by clicking the OLAP button on the Selection pane.
- Bottom Panel. Opens the OLAP Selections pane below the report. The Measures, Graph, and Dimension controls, as well as the band containing the OLAP, Run, and Reset buttons appear below the report output. You can open the Control Panel by clicking the OLAP button on the Selection pane.
- Hidden Panel. Opens the OLAP report with the OLAP Selections pane hidden. You can perform a variety of analytic tasks from the report itself. Selection Criteria is shown next to the OLAP button.
- Show Tabbed. For OLAP reports that have multiple dimensions, this option groups the dimension elements under a tab labeled with the dimension name.
Drill Down options
These options enable you to sort instantly from high to low or low to high for selected report columns:
- None. Disables automatic drill downs.
- Dimensions. Enables automatic drill downs on dimensions in both reports and graphs.
- Dimensions and Measures. Enables automatic drill downs on dimensions in both reports and graphs and, also, on measures in reports.
Note: Explicit drill downs in a StyleSheet (if they exist) take precedence over OLAP-enabled hyperlinks. If you click a hyperlink associated with an explicit drill down, the behavior will be defined by the StyleSheet rather than by the AutoDrill On or All settings.