These topics describe how you can access debugging information
and enable tracing options.
xYour Browser's Java Console
When you encounter problems with Java applets in the
Internet Explorer, you can receive valuable debugging information
by looking in the Internet Explorer Java Console. Access this from
the menu bar by clicking View and then Java
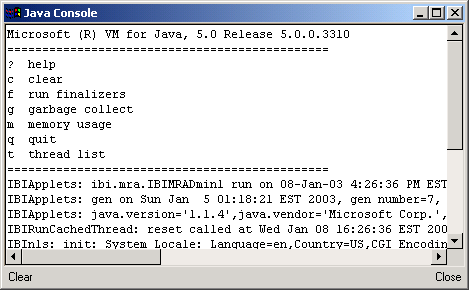
Console. The Java Console, as shown in the following
image shows you which Microsoft
Java Virtual Machine release you are using. The Java Console also
displays messages from the IBI Java code, such as the Managed Reporting
Java Gen number. Information Builders Customer Support Service (CSS)
may ask you to check for specific messages in this console to aid
in problem determination.

You may need to activate the Java Console if it does not appear
in your View menu. Activating the Java Console varies with each
Internet Explorer release. In Internet Explorer version 6.0, enable
the Java Console by selecting Tools, Internet
Options, Advanced, Microsoft
VM, and Java Console enabled. You
must restart your browser for the changes to take effect.
xTracing the WebFOCUS Client
To turn tracing on, set Trace=ON. For more information,
see the WebFOCUS Security and Administration manual.
xEnabling Tracing Options in Dashboard
By default, the Dashboard tracing option is not turned
on. Tracing should only be turned on when requested to do so by
an Information Builders representative.
Tracing is only active when the TRACE_LEVEL parameter exists
with a valid value. To turn the Dashboard tracing option on, add
the TRACE_LEVEL initialization parameter in the servlet engine configuration.
For details, see How to Add the TRACE_LEVEL Parameter for Windows and How to Add the TRACE_LEVEL Parameter for UNIX and z/OS.
All trace files are created in the ibi\WebFOCUS77\worp\log directory.
A trace file is created for every session, therefore it is possible
to have many trace files generated for one user.
You can turn on traces dynamically by editing the bid-config.xml
file. See How to Turn On Dynamic Tracing in Dashboard.
x
Procedure: How to Add the TRACE_LEVEL Parameter for Windows
-
Open
the ServletExec Administration tool.
-
Below
Web Applications, click Manage.
-
Below
WebFOCUS77 Application Name, click web.xml.
-
Below Servlets,
click Manage.
-
Below
Servlet Name, click WORP_Loader.
-
Below
Initialization Parameters, add the following:
- name: TRACE_LEVEL.
- value: FATAL,
ERROR, WARN, INFO, or DEBUG. FATAL is for minimum tracing, DEBUG
is for maximum tracing, and OFF turns the tracing option off.
Descriptions
are optional.
-
Click Submit.
-
From
the Configure Web Applications window, click Reload for
the WebFOCUS77 application.
x
Procedure: How to Add the TRACE_LEVEL Parameter for UNIX and z/OS
-
From
the WEB-INF directory, open the web.xml file.
-
Add the
following immediately preceding the </servlet> line:
<init-param>
    <param-name>TRACE_LEVEL</param-name>
    <param-value>DEBUG</param-value>
</init-param>
-
Save
and close the file.
x
Procedure: How to Remove or Modify the TRACE_LEVEL Parameter for Windows
-
Open
the ServletExec Administration tool.
-
Below
Web Applications, click Manage.
-
Below
WebFOCUS77 Application Name, click web.xml.
-
Below
Servlets, click Manage.
-
Below
Servlet Name, click WORP_Loader.
-
Below
Initialization Parameters, delete the TRACE_LEVEL parameter, or change
the value to OFF.
-
Click Submit.
-
From
the Configure Web Applications window, click Reload for
the WebFOCUS77 application.
x
Procedure: How to Remove or Modify the TRACE_LEVEL Parameter for UNIX and z/OS
-
From
the WEB-INF directory, open the web.xml file.
-
Change
the value in the TRACE_LEVEL parameter to OFF as follows:
<init-param>
    <param-name>TRACE_LEVEL</param-name>
    <param-value>OFF</param-value>
</init-param>
Alternatively, you can delete
the lines that were added for TRACE_LEVEL in the web.xml file.
-
Save
and close the file.
x
Procedure: How to Turn On Dynamic Tracing in Dashboard
-
In the
WebFOCUS77\worp\conf directory, open the bid-config.xml file in
a text editor.
Find the following line:
<trace-option trace-flag="false" trace-level="DEBUG"/>
-
Change
the trace-flag value to true.
-
Save
and close the file.
You do not need to reload the servlet.
x
Reference: Dashboard Trace File Names
Trace
files are named as follows:
<username>_<date>_<timestamp>.log
ADMIN_20070829_140159.log
where:
- username
Is the name used by the user to log in, not the description
in Managed Reporting.
- date
Is the date in yyyymmdd date format. For example, 20070829.
- timestamp
Is the time using 24-hour hhmmss time format. For example,
such as 140159.
The log file for a user
logged in as ADMIN on Aug 29th, 2007 at 2:01:59 PM would be:
ADMIN_20070829_140159.log
x
Reference: Dashboard Trace File Contents
Trace
files contain the following information:
<thread number> <date> <time> <level> <location> <message>
where:
- thread number
Is the number generated for each new task performed in the servlet.
- date
Is the date when the line of trace code is created. The format
is MM/DD/YYYY.
- time
Is the time when the particular trace code has been written
to the trace file. The format is hh:mm:ss:nnn.
- level
Is the TRACE_LEVEL defined in the servlet parameters. Valid
entries are FATAL, ERROR, WARN, INFO, DEBUG or OFF.
- location
Is the internal location called by the Dashboard. The format
is <Java class name>.<Java method name>.
- message
Is the internal trace text.
