- Select the Format tab in the Control Panel.
- Click the Auto Drill & Analysis button in the Navigation group.
-
From the OLAP group, as shown in the following image, you can
select Olap panel not accessible, Olap panel accessible (default),
Dimension filtering enabled, Dimensions grouped in tabs, or More
options. These options are mutually exclusive meaning that only
one can be selected at a time. Clicking the arrow portion of the
Auto Drill & Analysis button will display the context menu.
Note: The context menu automatically goes away after you click on one of the menu options, click the arrow again, or click anywhere else on the screen. This means only one selection or action can be performed in the context menu at a time.
Selecting OLAP panel not accessible means that only the sorting options will display in the column titles and the OCP (OLAP Control Panel) cannot be accessed from the title options.
Selecting OLAP panel accessible (the default) allows access to the OLAP panel using the Auto Drill & Analysis button in the output of the report.
Note: Using this option versus the hidden option allows the user to better distinguish the difference between the first and second options. The hidden option is available by accessing the Navigation dialog.
Selecting Dimension filtering enabled means that dimension filters are displayed at the top of the report. Customizing the filter placement must be done in the Navigation dialog box (accessed by clicking More options…).
Selecting Dimensions grouped in tabs means that the dimension filters are grouped into tabs based on hierarchy/within statements in the metadata.
If you select More options, the Auto Drill & Analysis dialog box opens, as shown in the following image.
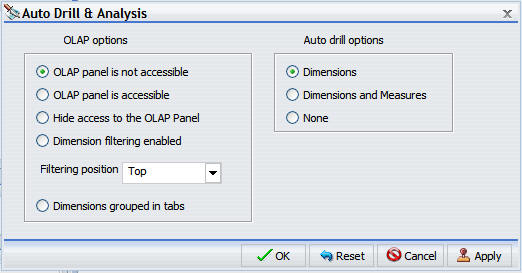
The Auto Drill & Analysis dialog box allows the following additional configuration/customization options for OLAP output.
- Selecting OLAP panel is not accessible means that only the sorting options will display in the column titles and the OCP (OLAP Control Panel) cannot be accessed from the title options.
- Selecting OLAP panel is accessible allows access to the OLAP panel using the OLAP button in the output of the report.
- Selecting Hide access to the OLAP panel hides access to the OLAP panel.
- Selecting Dimension filtering enabled provides a secondary positioning option allowing placement of the filters on the Top (default) or Bottom of the report. Note: If the Dimension filtering enabled option is deselected at any time, the position option resets to Top.
- Selecting Dimensions grouped in tabs means that the dimension filters are grouped into tabs based on hierarchy/within statements in the metadata.
- Selecting an
Auto drill option, which is set to None by default, can only be changed
in the Auto Drill & Analysis dialog box. The dialog box has
the following options for auto drill.
- Dimensions enables automatic drill downs on dimensions in both reports and graphs.
- Dimensions and Measures (the default), enables automatic drill downs on dimensions in both reports and graphs and, also, on measures in reports.
- None disables automatic drill downs.
- Run the report.
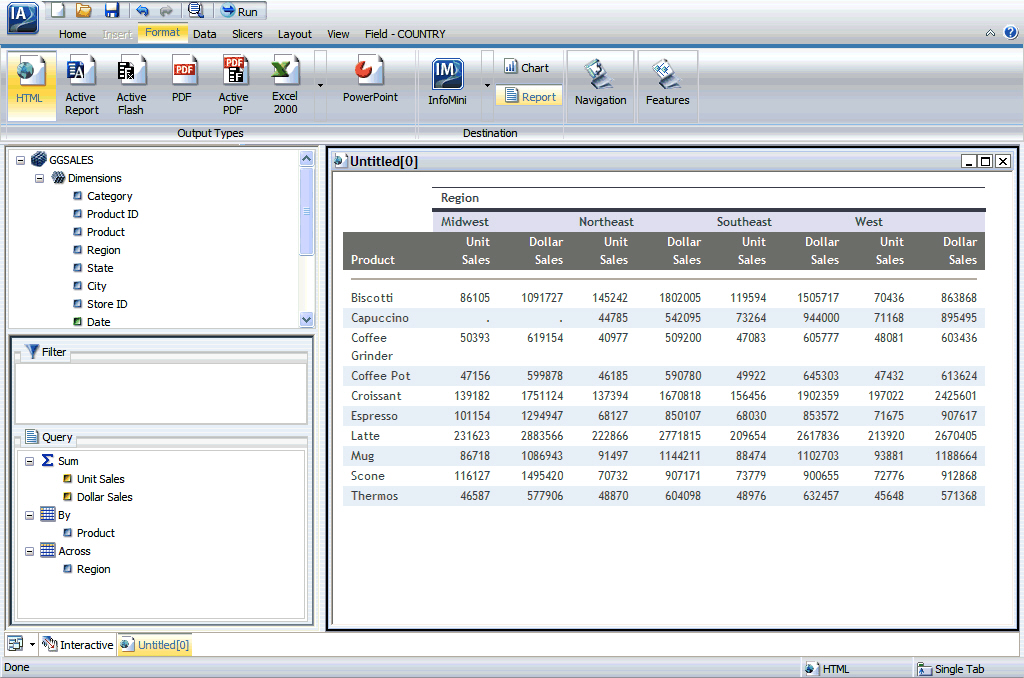
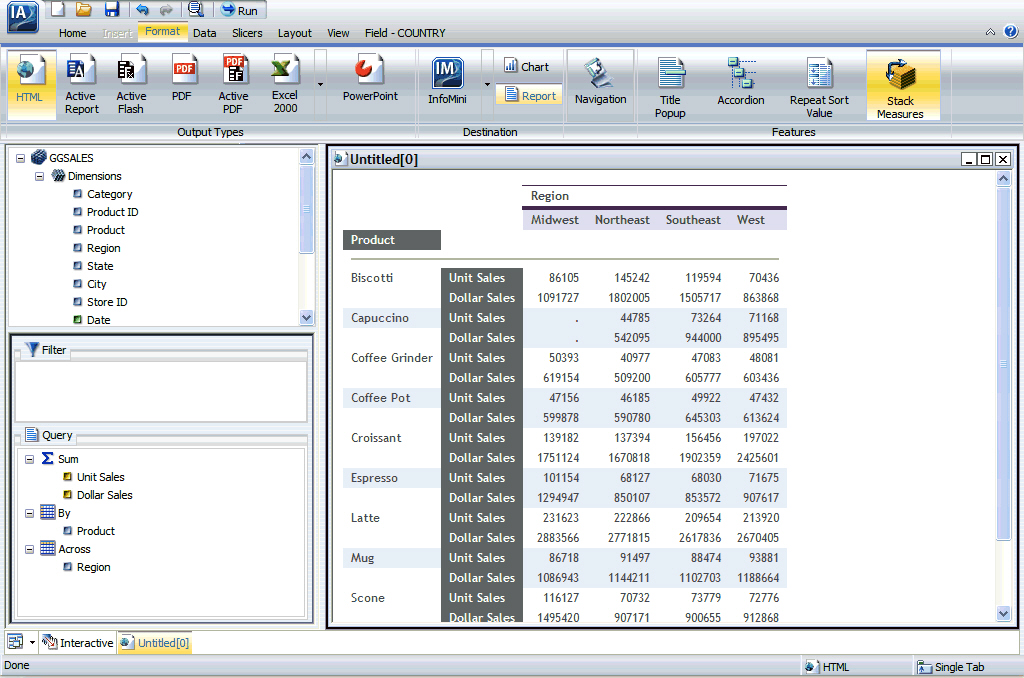
Selecting an option from the OLAP group, such as OLAP panel is accessible, generates output that invokes OLAP processing. The following image is an example of an OLAP report. The OLAP button below the report launches the OLAP Control Panel when clicked.